
Summary
- In 2024, 35.2% of EU migrants and 32.1% of non-EU migrants aged 25 to 64 in the European Union had tertiary education, reflecting steady long-term gains in both groups. In comparison, 36.8% of EU natives in the same age group held tertiary qualifications.
- Women are consistently more likely than men to have tertiary education, among both immigrant groups and natives. Between 2010 and 2024, the gender gap widened more among natives, reaching 6.4 percentage points in 2024 (+4.7), compared to 4.5 points among EU immigrants (+1.4) and non-EU immigrants (+2.5).
- Tertiary education among migrants has increased across all EU countries since 2010, with the largest gains for EU immigrants observed in Poland, Sweden, and Latvia and for non-EU immigrants in Latvia, Denmark, Luxembourg, and Portugal.
- A positive cross-country correlation exists between native and immigrant tertiary education levels: countries with better-educated natives tend to host better-educated immigrants. Nonetheless, gaps vary widely: for example, in Poland, Sweden, and Luxembourg, EU immigrants significantly surpass natives, while in Italy, Greece, and Spain, they lag substantially behind natives.
In 2024, the share of EU immigrants aged 25 to 64 with at least tertiary education reached a record high of 35.2%, up by 1.4 percentage points from the previous year. Similar increases were observed among non-EU immigrants (+1.2 percentage points) and natives (+1 percentage point).
The long-term trend in Figure 1 shows steady educational improvement across all groups, with EU immigrants closely following the levels of natives. Between 2010 and 2016, EU immigrants consistently exhibited the highest proportion of individuals with tertiary education, exceeding that of natives. However, this pattern reversed around 2017, as the pace of educational advancement among EU immigrants slowed relative to natives, possibly driven by changes in the composition of EU migrant inflows, particularly in the years 2017 and 2022.
Despite maintaining the lowest levels of tertiary educational attainment among the three demographic groups, non-EU immigrants in the European Union have shown gradual but consistent improvement, with the share of highly educated individuals rising by 9 percentage points between 2010 and 2024.
Figure 1
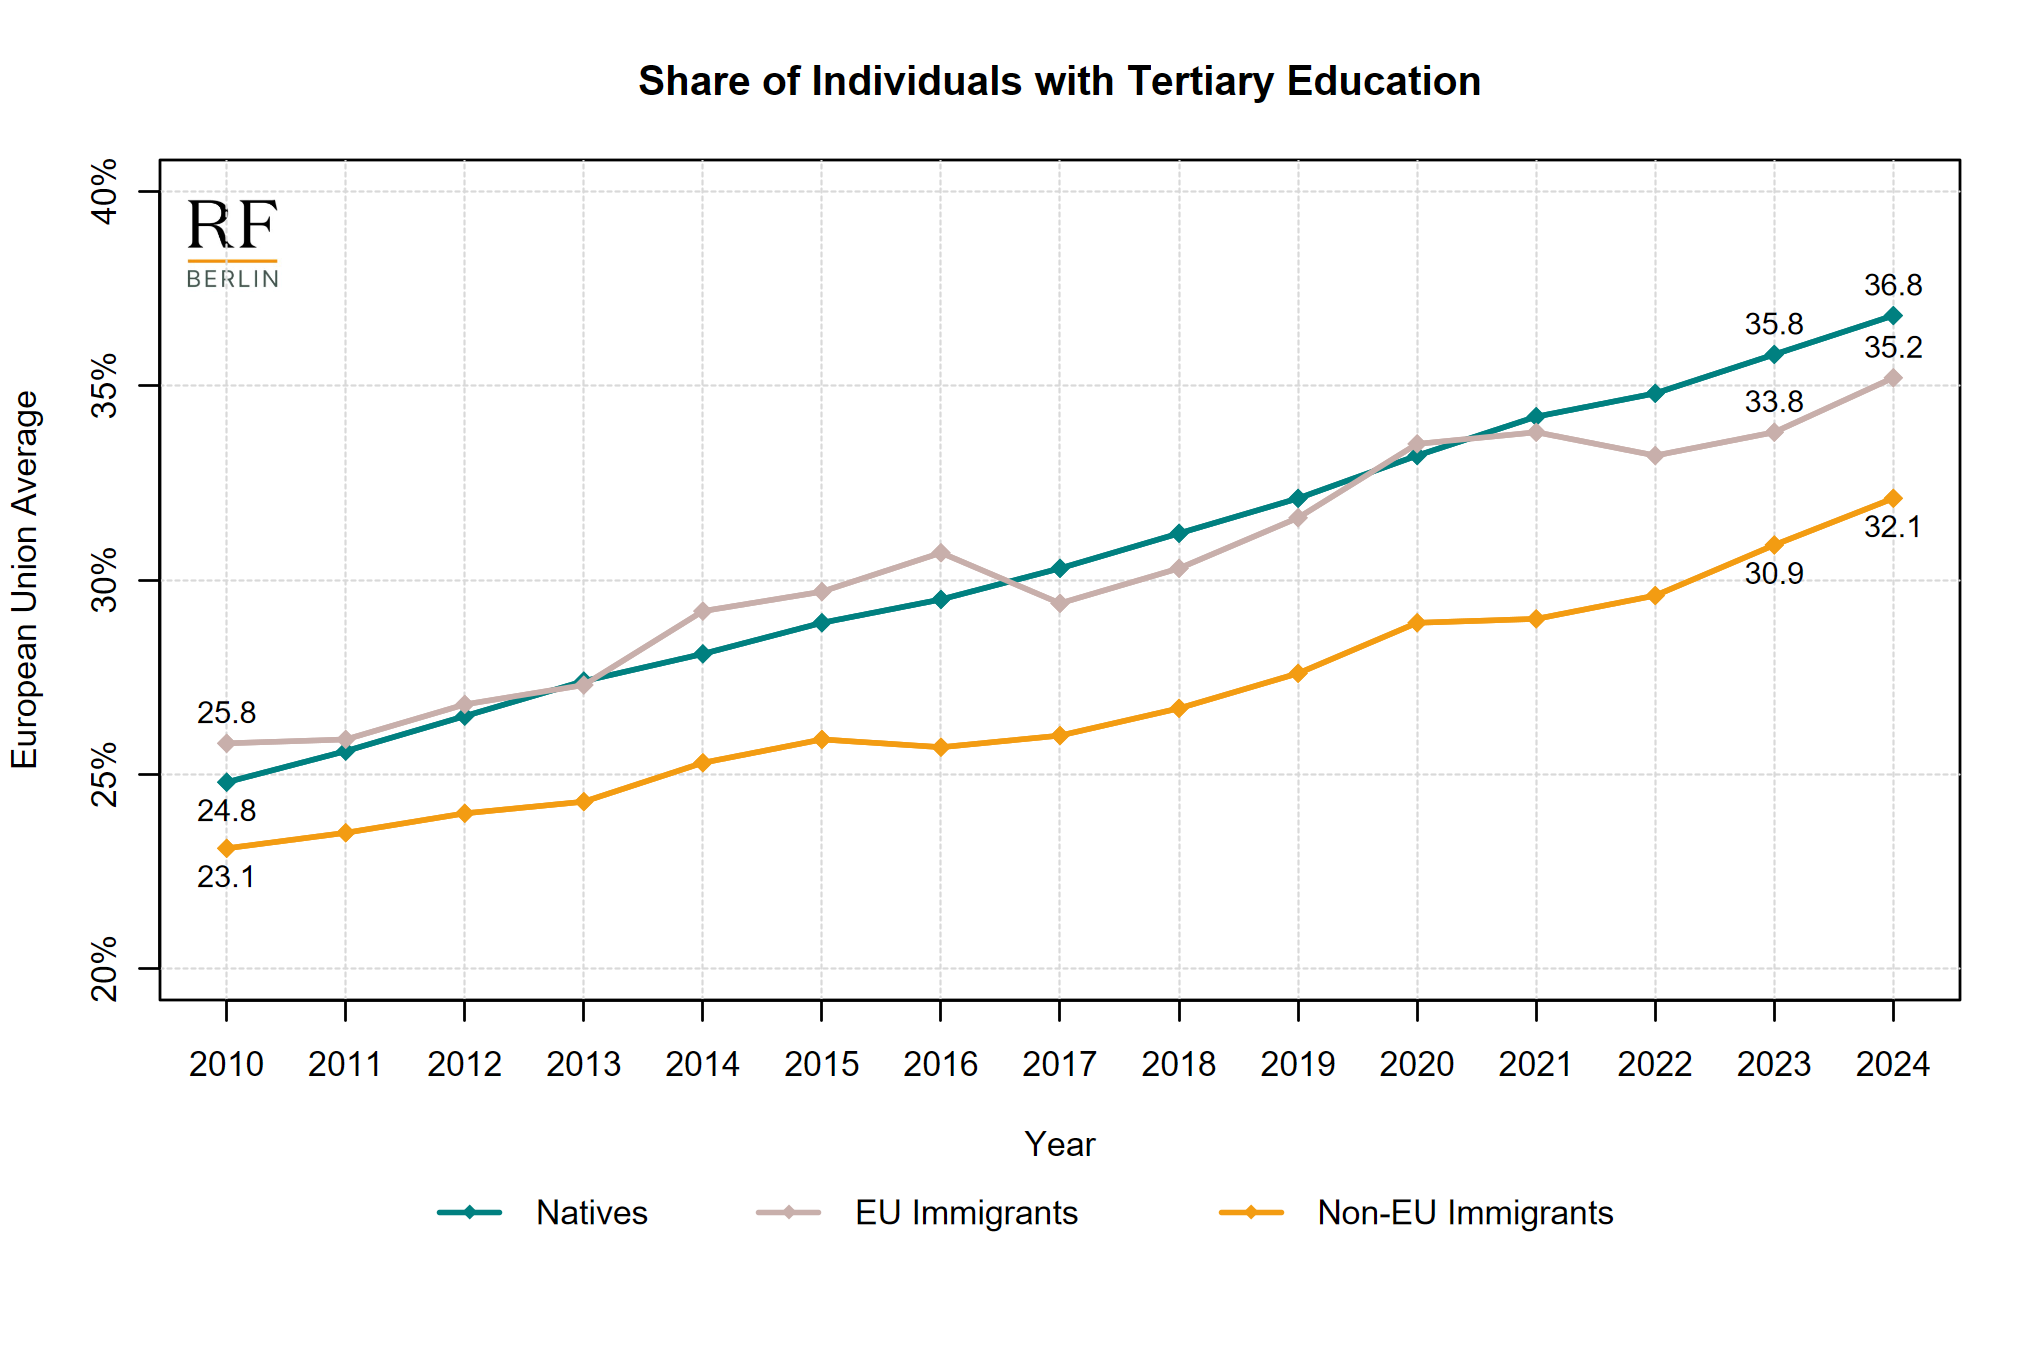
Source: Eurostat, EDAT_LFS. Notes: the figure reports the shares of individuals aged 25 to 64 with completed tertiary education in each population group from 2010 to 2024 in the European Union. Immigrants are defined as individuals born in a country other than the one in which they reside. Individuals who completed tertiary education have successfully obtained a degree or equivalent qualification from a college, university, or other post-secondary educational institution. The European Union includes all 27 European Member States as of February 1st, 2020.
Across all three demographic groups, women consistently attain higher levels of tertiary education than their male counterparts. Figure 2 shows that native and EU-immigrant women have consistently held the highest shares of tertiary educational attainment. Interestingly, the gender gap in tertiary education has widened more rapidly among natives than among immigrant groups. By 2024, the gender gap in tertiary education in favor of women reached 6.4 percentage points among natives (an increase of 4.7 points since 2010), 4.5 points among EU immigrants (+1.4 points), and 4.5 points among non-EU immigrants (+2.5 points).
Figure 2
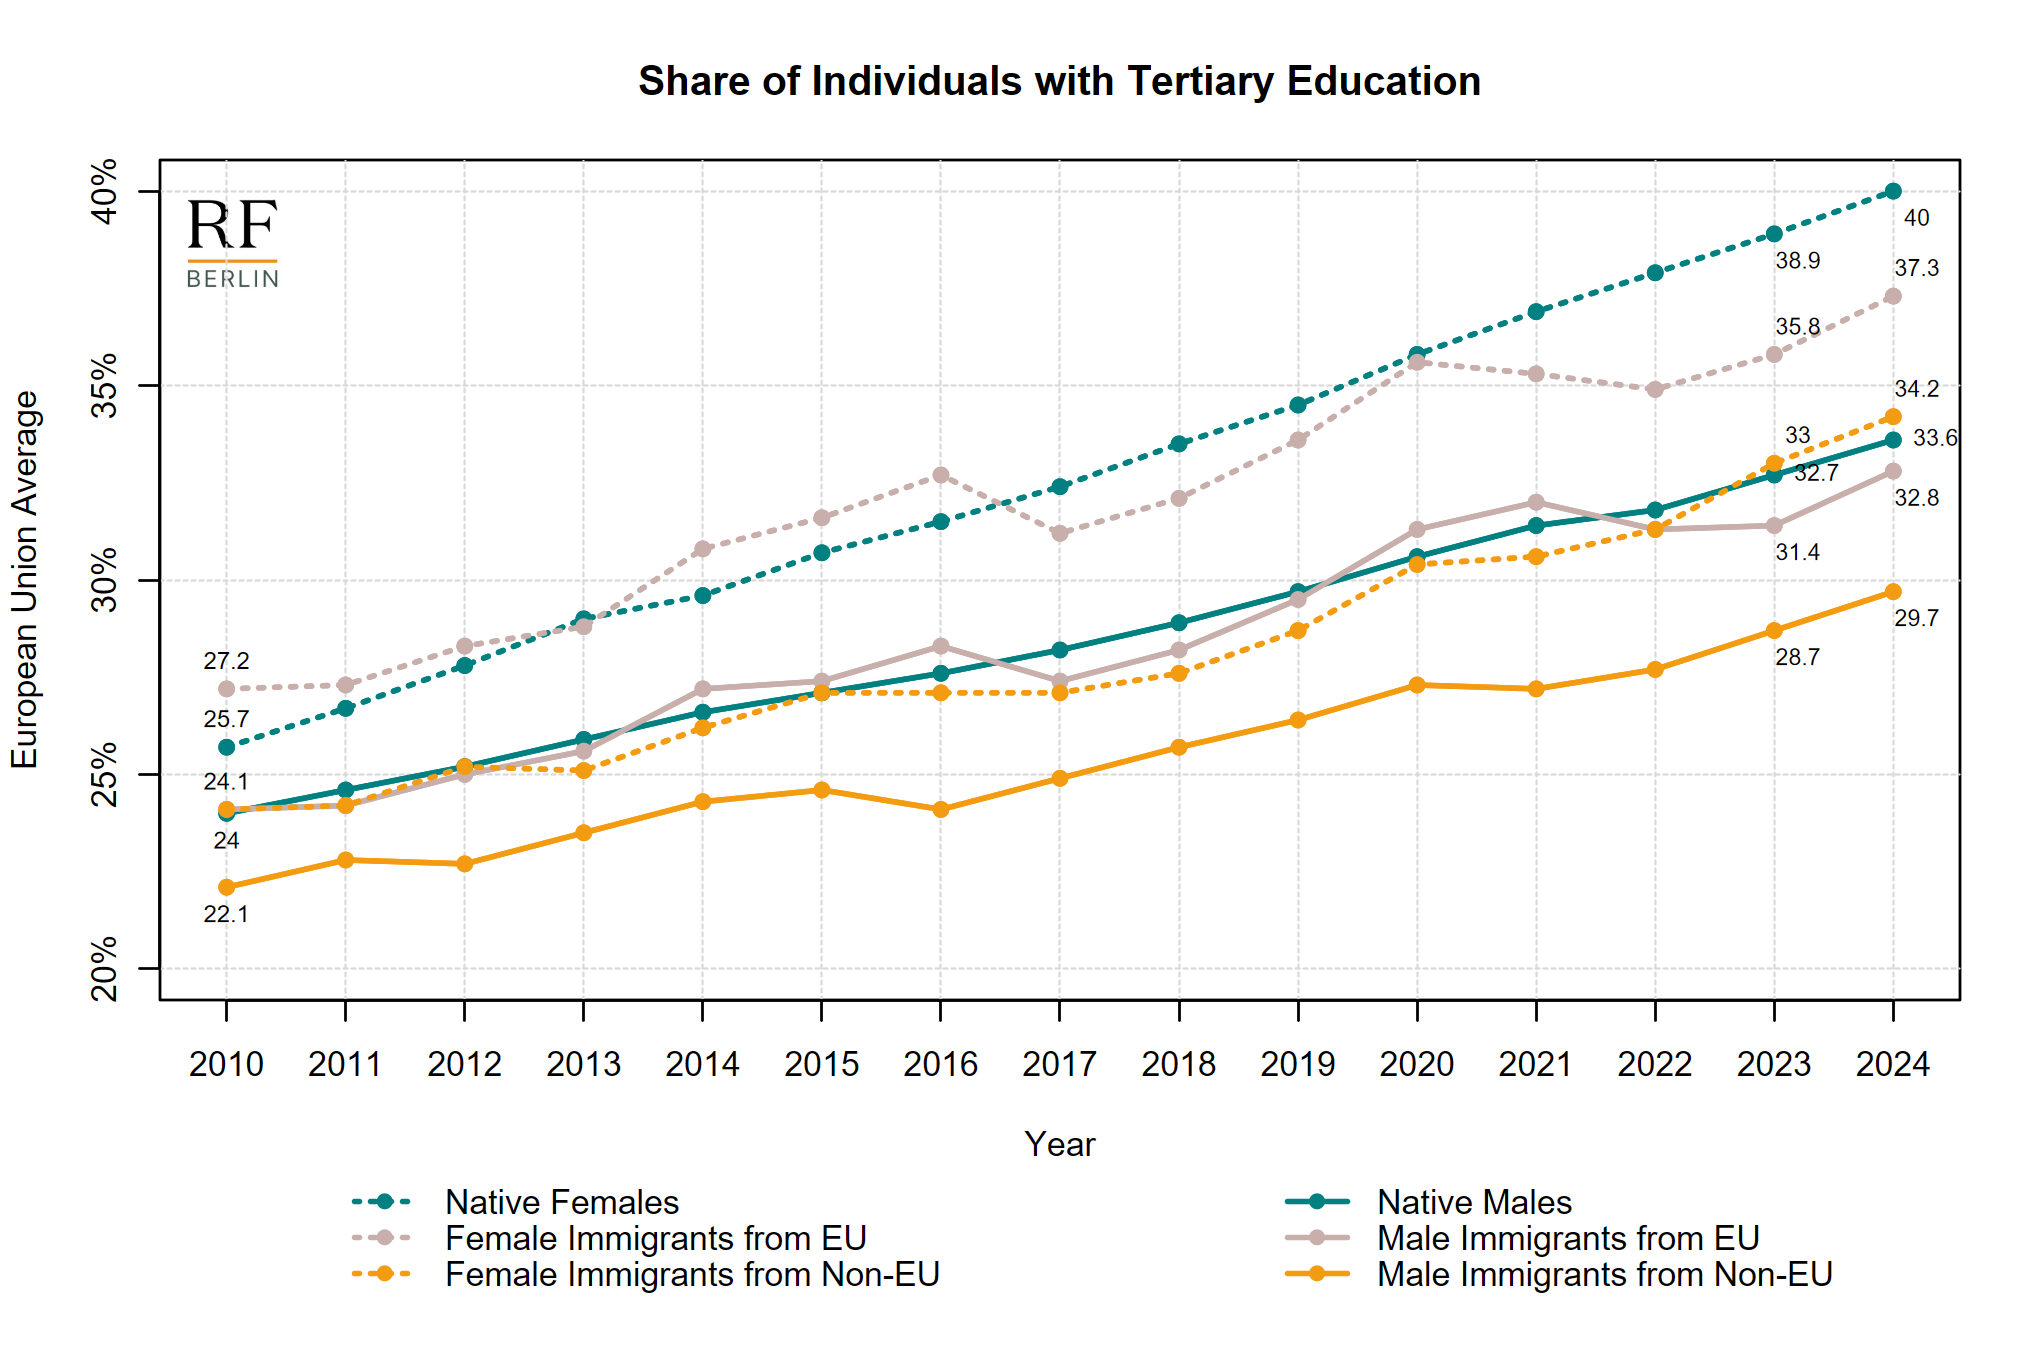
Source: Eurostat, EDAT_LFS. Notes: the figure reports the shares individuals aged 25 to 64 with completed tertiary education in each population group from 2010 to 2024 in the European Union. Immigrants are defined as individuals born in a country other than the one in which they reside. Individuals who completed tertiary education have successfully obtained a degree or equivalent qualification from a college, university, or other post-secondary educational institution. The European Union includes all 27 European Member States as of February 1st, 2020.
Levels and trends in tertiary education among migrants show substantial heterogeneity across countries. Figure 3 illustrates changes in tertiary education levels among EU and non EU immigrants from 2010 to 2024 across European countries. All countries exhibit a general upward trend in tertiary education levels among both EU and non-EU immigrant groups over time. Countries such as Poland, Sweden, and Latvia show the largest increases in the share of tertiary-educated EU immigrants, all with gains of more than 23 percentage points between 2010 and 2024. Latvia, Denmark, Luxembourg, and Portugal show the largest increases in the share of tertiary-educated non-EU immigrants, with gains of more than 16 percentage points over the same period. To compare long-term improvements in educational attainment between migrants and natives, Figure A.1 in the Appendix shows the trends in the ratio of tertiary-educated migrants to the corresponding share of natives, revealing significant cross-country heterogeneity.
Figure 3
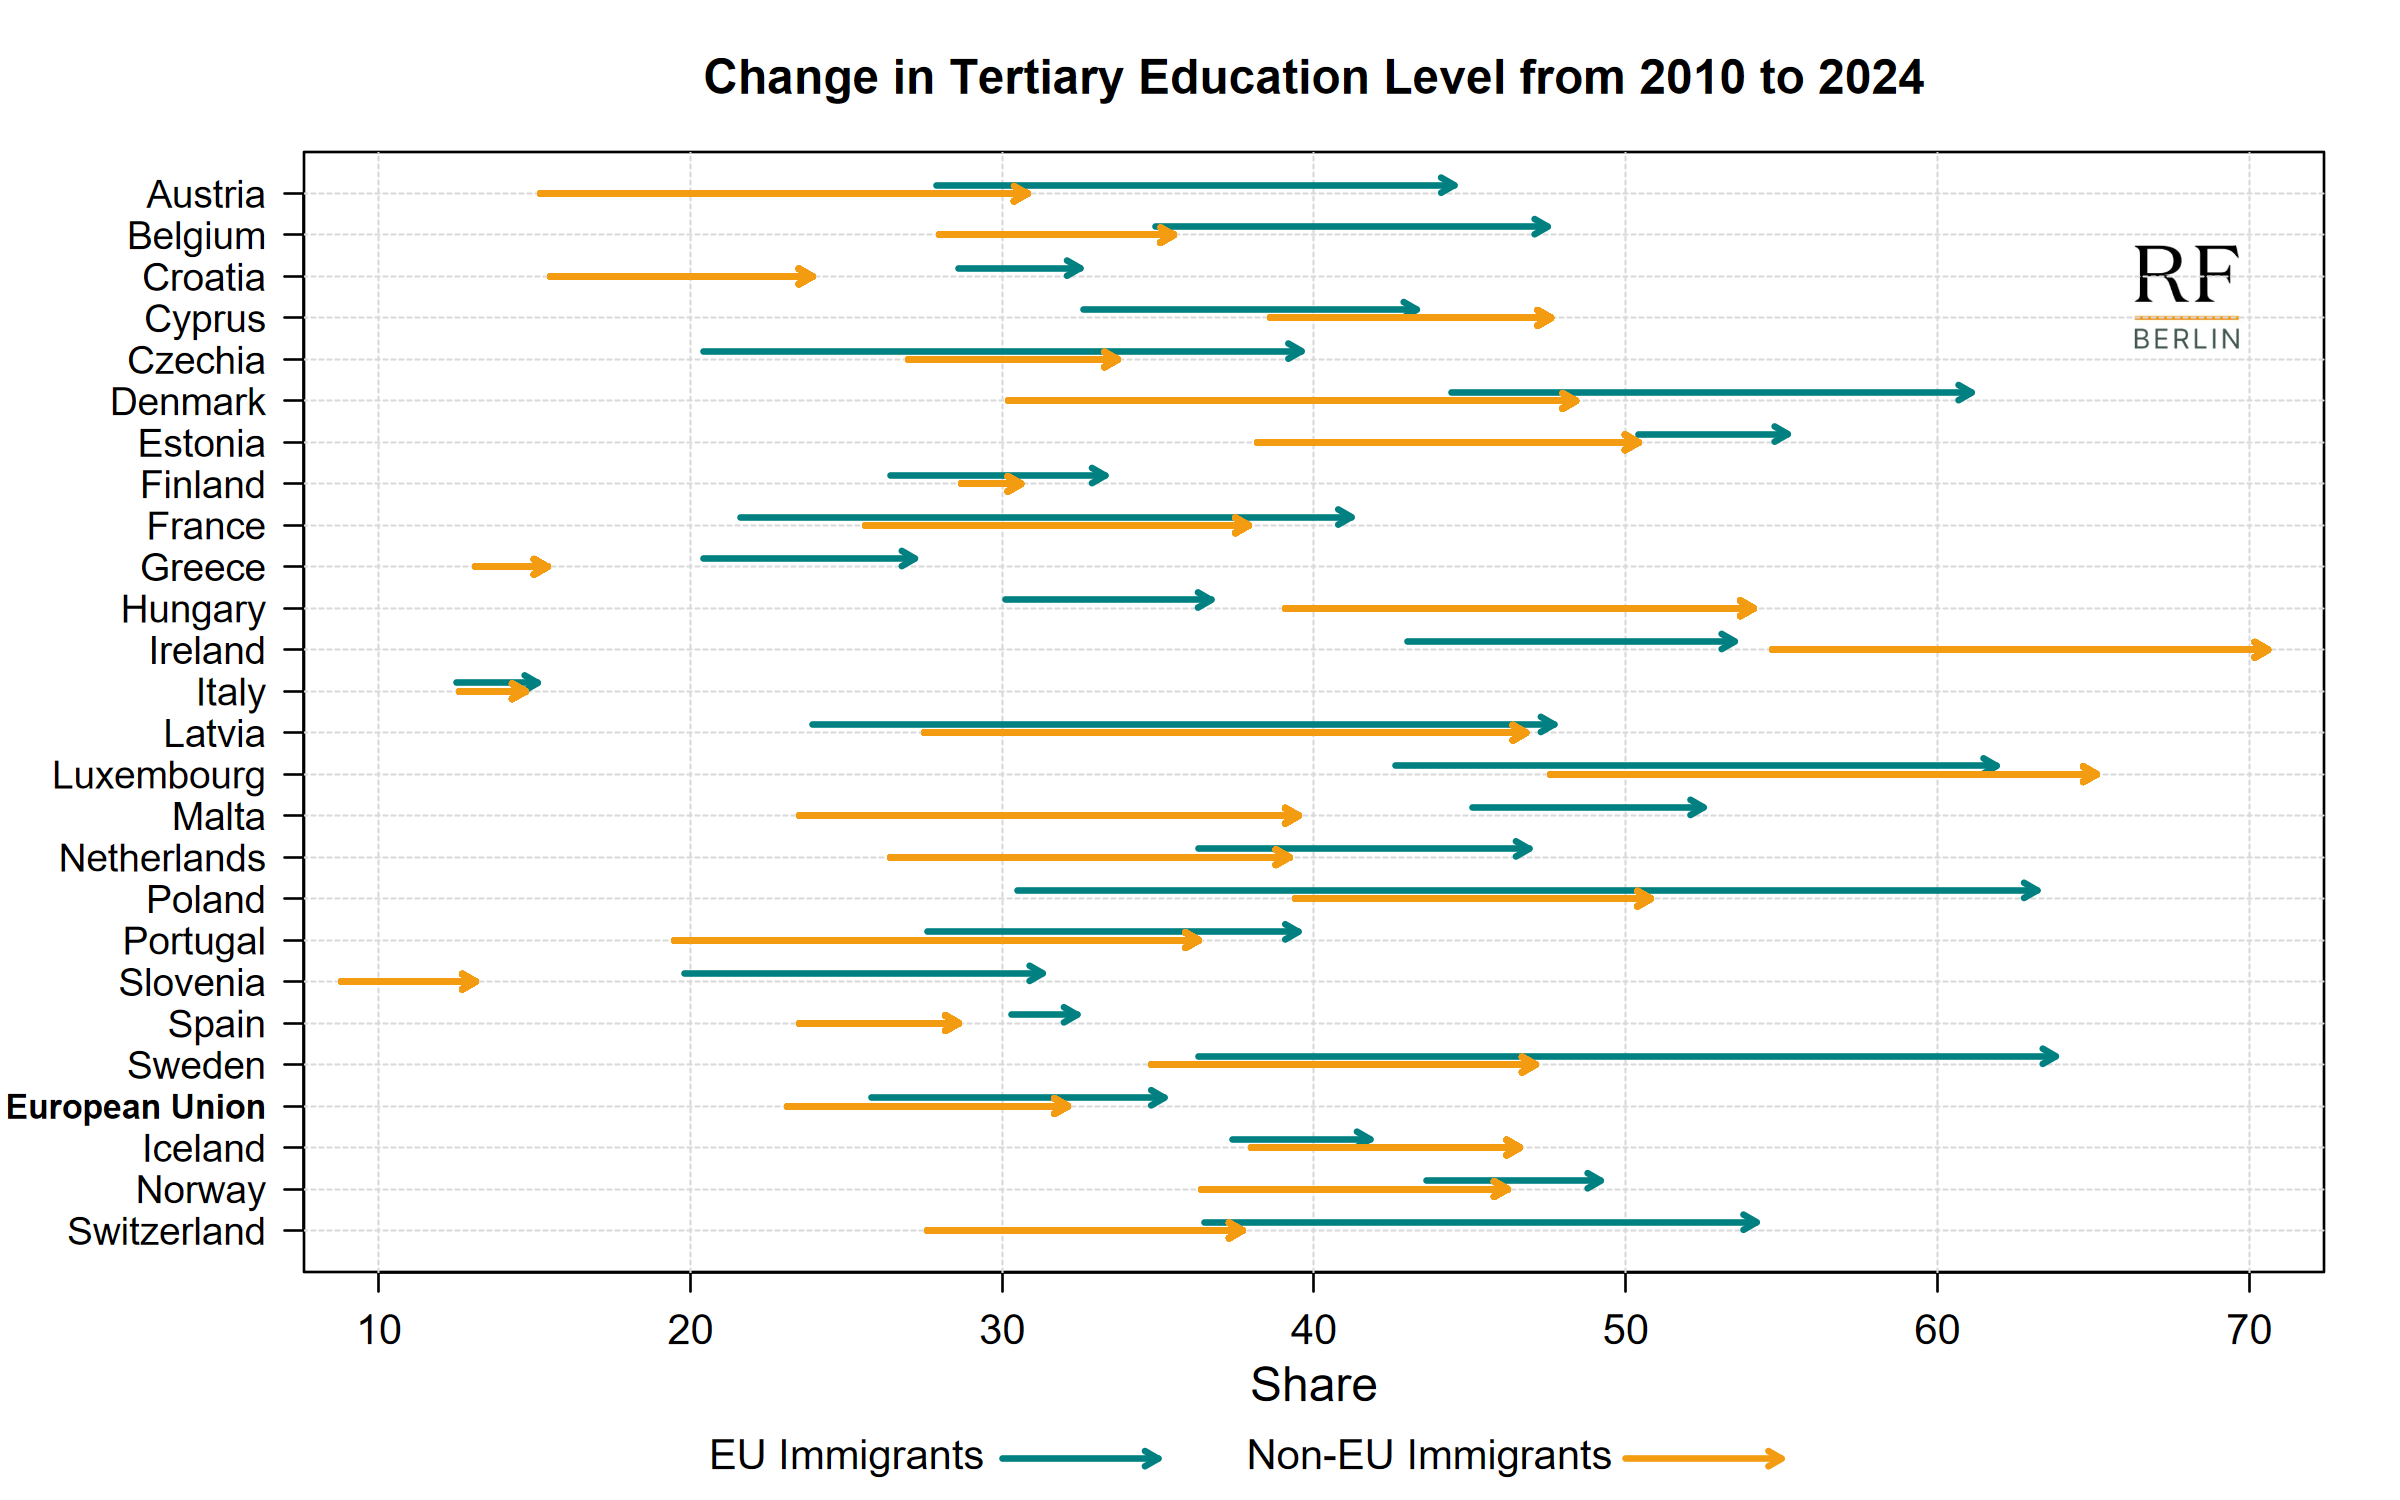
Source: Eurostat, EDAT_LFS. Notes: the figure reports the shares of foreign-born individuals aged 25 to 64 with completed tertiary education by country in 2010 and 2024. Immigrants are defined as individuals born in a country other than the one in which they reside. Individuals who completed tertiary education have successfully obtained a degree or equivalent qualification from a college, university, or other post-secondary educational institution. Bulgaria, Germany, Lithuania, Romania, Slovakia are not shown due to missing data. The European Union includes all 27 European Member States as of February 1st, 2020.
Conversely, Greece, Italy, and Slovenia show the lowest initial levels of tertiary-educated non EU migrants in 2010, all below 15%, and exhibit the smallest gains in tertiary education levels over the 2010–2024 period. However, Greece and Slovenia report higher initial levels of tertiary-educated EU immigrants (around 20% in 2010) and more substantial improvements over time. In contrast, Italy reports the lowest share of tertiary-educated EU immigrants, with only a modest increase from 12.5% to 15.1% over the 2010–2024 period.
As a result of these heterogeneous trends, countries in 2024 display significant variation in the relative tertiary educational attainment of natives and migrants. Figure 4 shows that, in general, the education levels of immigrants and natives in European countries are positively correlated: countries with better-educated native populations also tend to host better educated immigrants. However, there is notable cross-country heterogeneity in the relative levels of tertiary-educated natives and immigrants. For example, Poland, Sweden, Luxembourg, and Denmark host EU immigrants whose average tertiary attainment exceeds that of natives by more than 15 percentage points (left panel). Similarly, Ireland, Luxembourg, and Hungary report the largest positive gaps between the tertiary education levels of non-EU immigrants and natives (right panel). Conversely, Italy, Greece, and Spain exhibit the largest negative gaps in tertiary education levels between EU immigrants and natives. Similarly, Slovenia, Greece, Spain, and Italy report the widest negative gaps in tertiary attainment between non-EU immigrants and native populations.
Figure 4
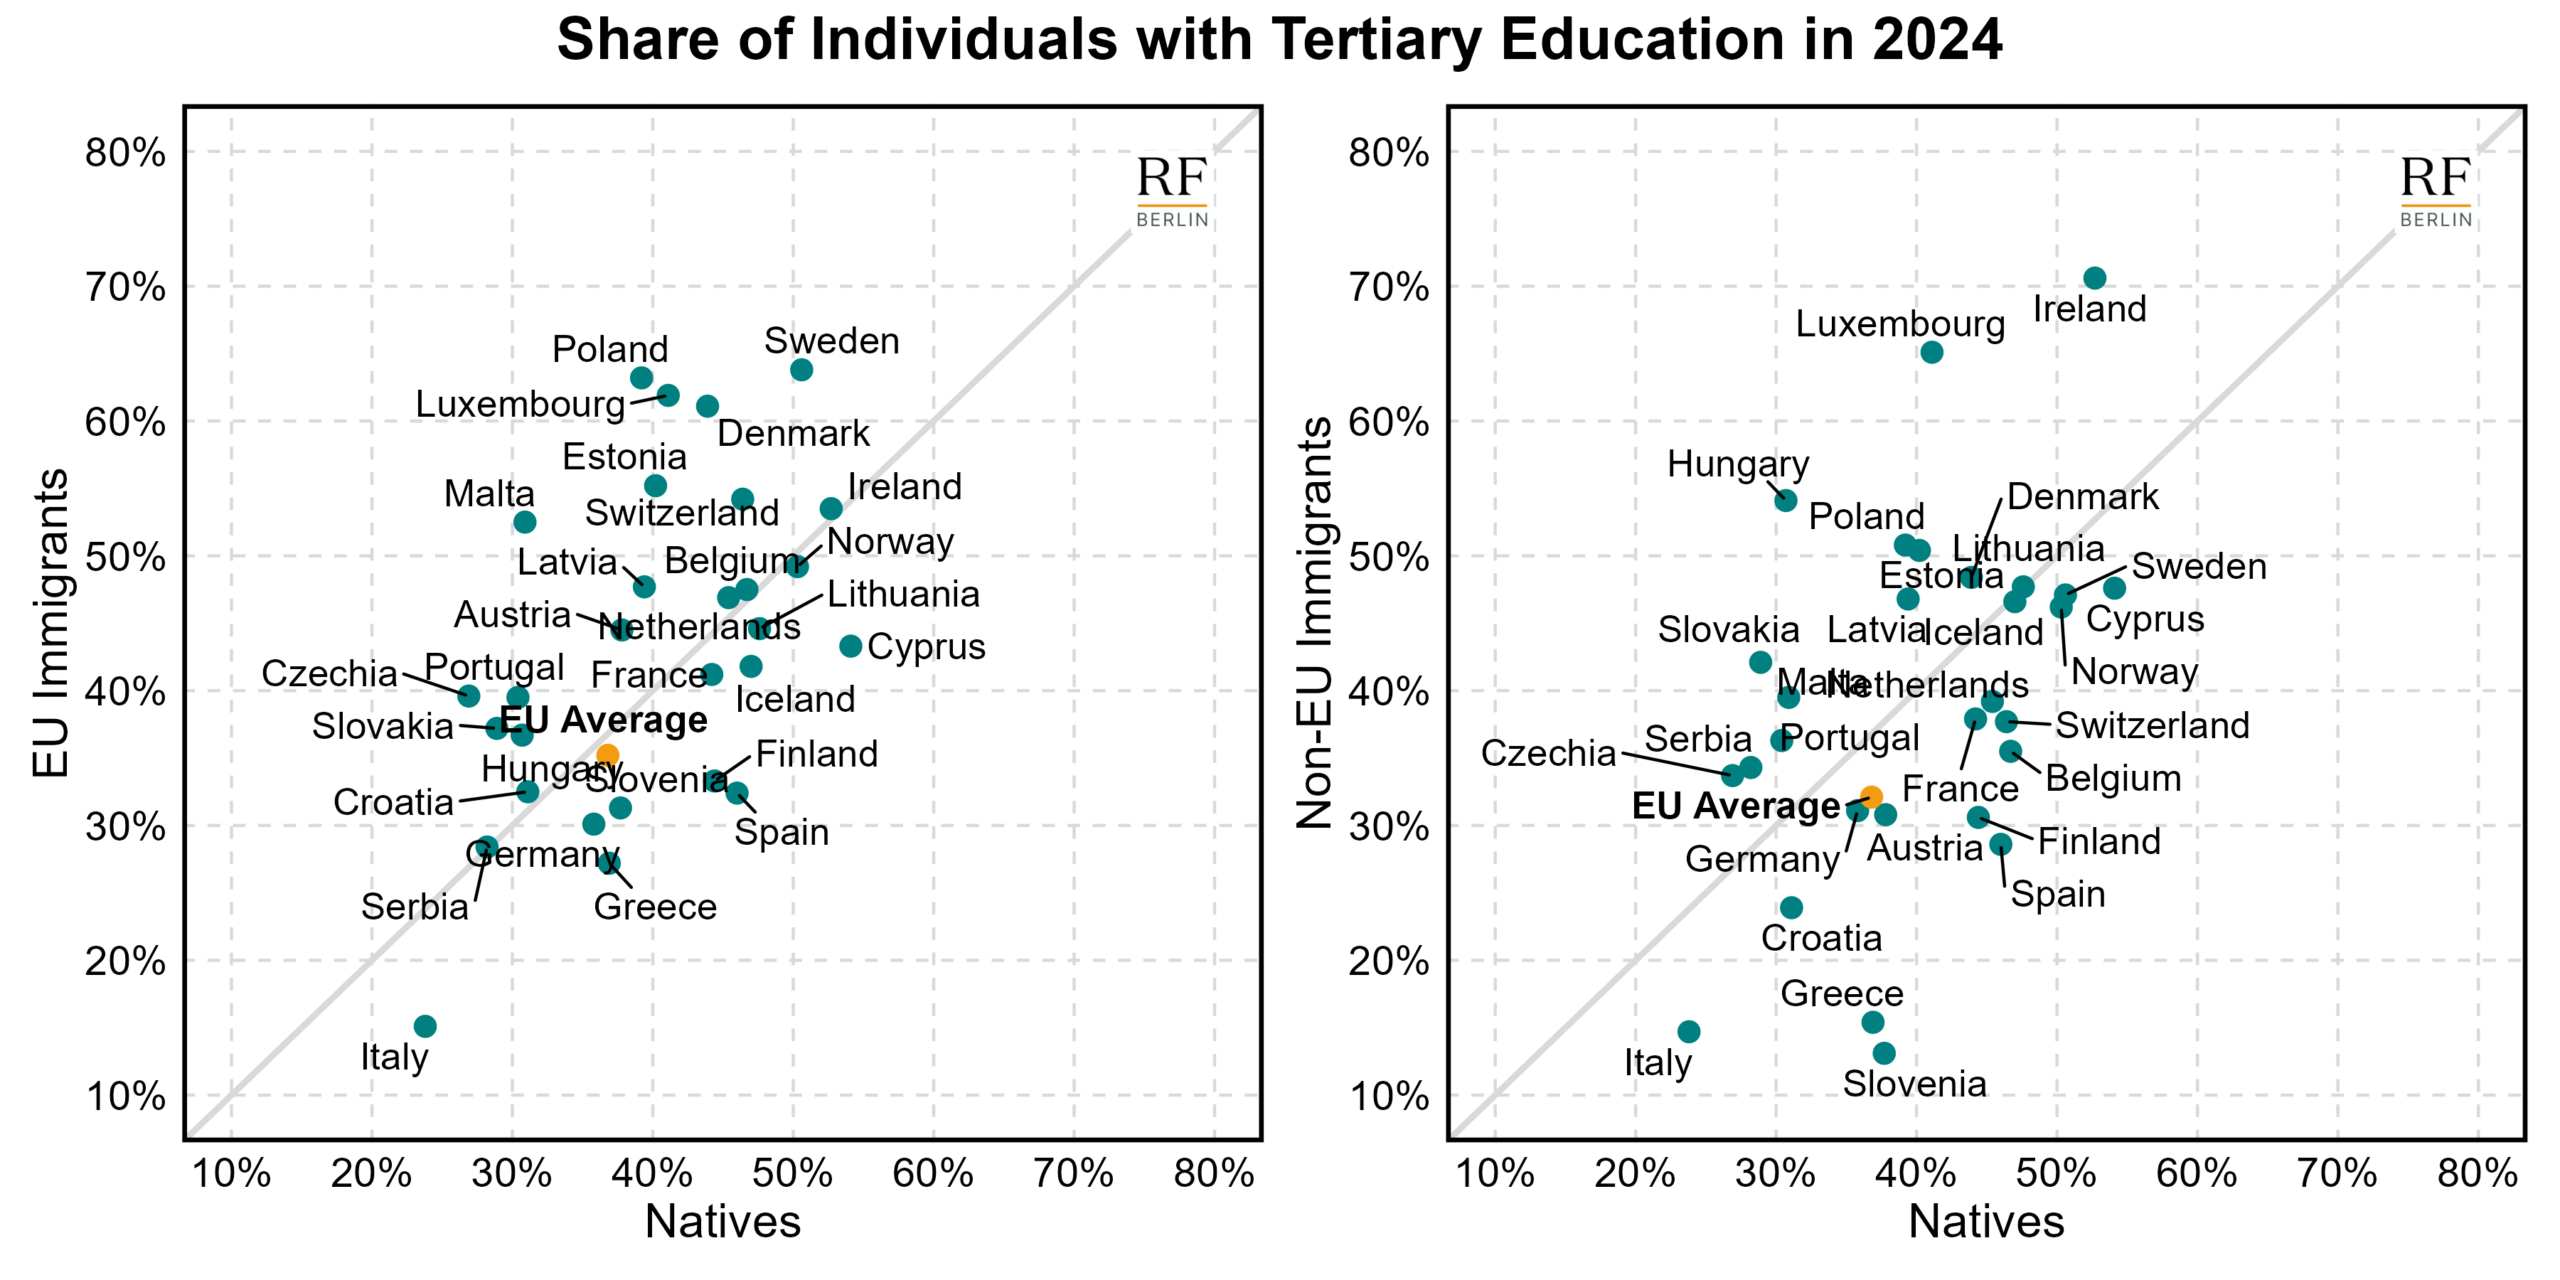
Source: Eurostat, EDAT_LFS. Notes: the figure reports the shares of immigrants and natives aged 25 to 64 with a completed tertiary education in 2024, by country. Immigrants are defined as individuals born in a country other than the one in which they reside. Individuals who completed tertiary education have successfully obtained a degree or equivalent qualification from a college, university, or other post secondary educational institution. The European Union includes all 27 European Member States as of February 1st, 2020.
Appendix
Figure A.1 shows divergent trends across countries in the educational attainment of migrants relative to natives. In countries such as Spain, Italy, and Greece, EU migrants had lower levels of tertiary education than natives in 2010, and this gap further widened by 2024, suggesting a faster improvement in educational attainment for natives than for migrants. Conversely, in France, EU migrants were initially less educated than natives in 2010 but substantially reduced the gap by 2024.
In countries like Sweden, Denmark, and Czechia, EU migrants were already more educated than natives in 2010, and this advantage increased further by 2024. In contrast, in Austria, Croatia, Hungary, and Portugal, EU migrants had a significantly higher education level than natives in 2010, but this advantage diminished by 2024.
Figure A.1
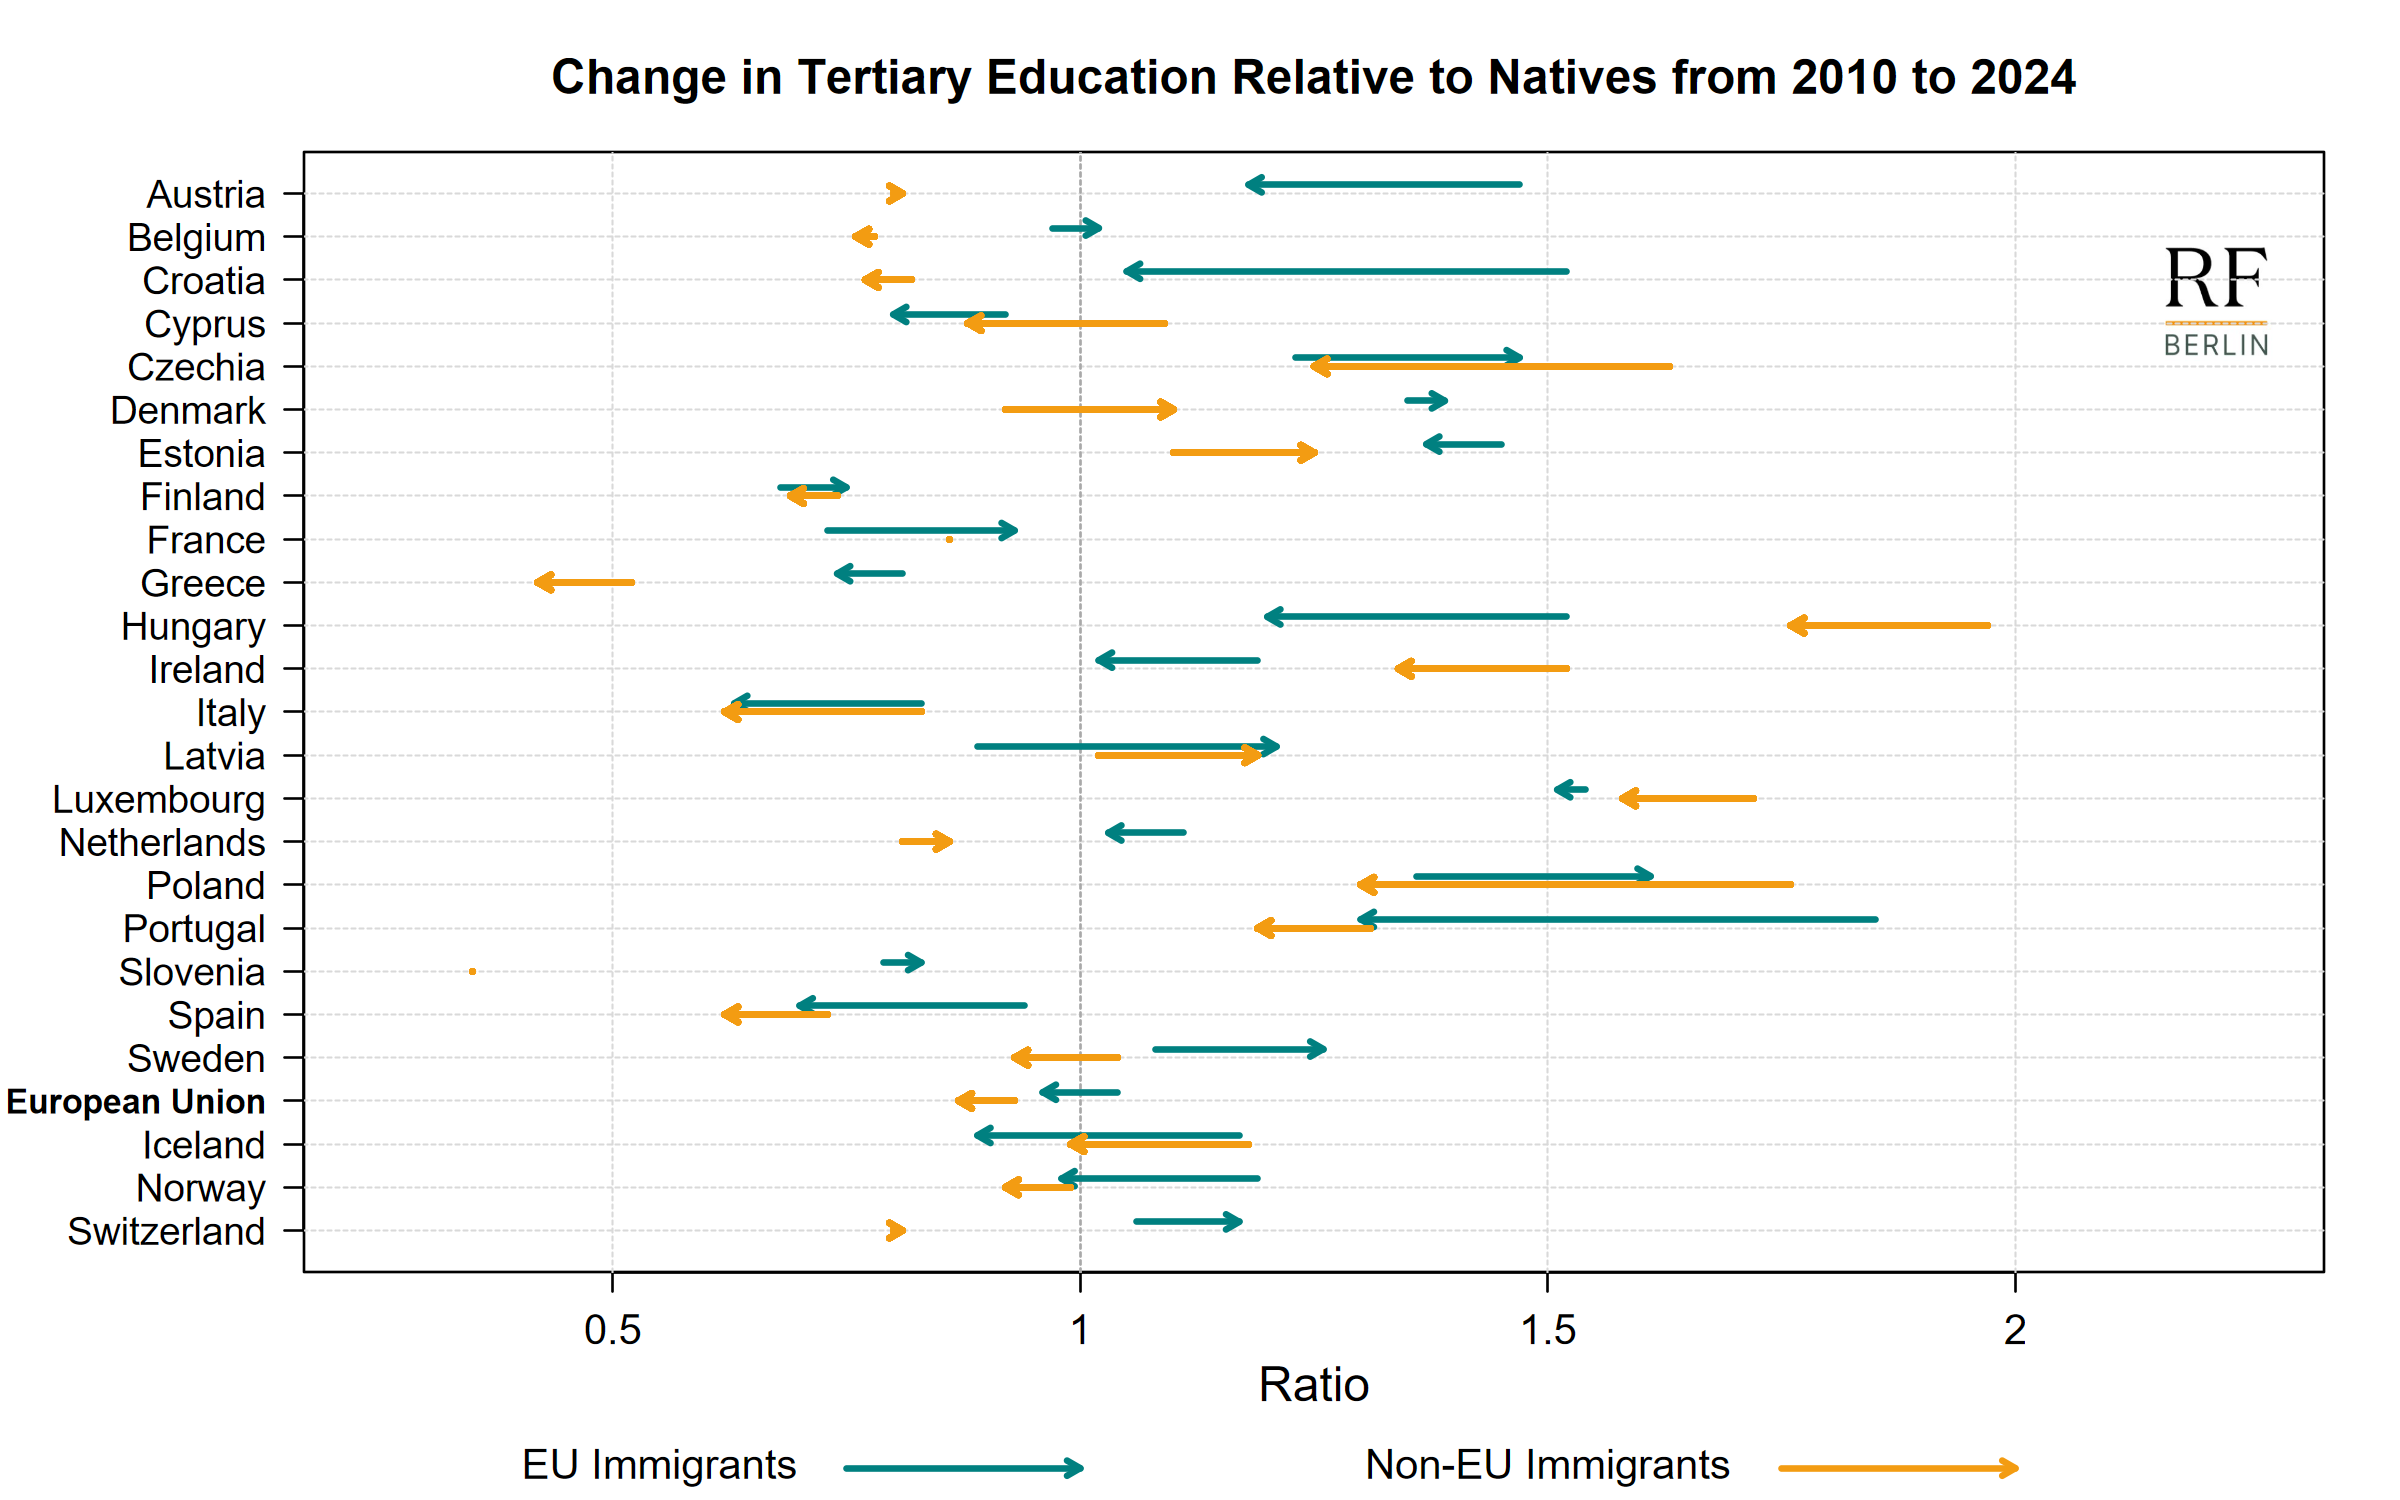
Source: Eurostat, EDAT_LFS. Notes: the figure shows the ratio of the share of foreign-born individuals aged 25 to 64 with completed tertiary education to that of natives, by country, in 2010 and 2024. Immigrants are defined as individuals born in a country other than the one in which they reside. Individuals who completed tertiary education have successfully obtained a degree or equivalent qualification from a college, university, or other post-secondary educational institution. Bulgaria, Germany, Lithuania, Romania, Slovakia are not shown due to missing data. For Malta (also not shown), the ratio of tertiary-educated individuals aged 25 to 64 relative to natives declined from 3.2 to 1.7 for EU migrants, and from 1.6 to 1.3 for non-EU migrants. The European Union includes all 27 European Member States as of February 1st, 2020.
For non-EU migrants, Italy, Spain, and Greece hosted individuals who were less educated than natives in 2010, with the gap worsening by 2024. In contrast, Denmark, Estonia, and Latvia saw notable improvements in the relative educational attainment of non-EU migrants, who became, on average, more educated than natives by 2024. On the other hand, in Czechia, Hungary, and Poland, non-EU migrants had a notably higher level of educational attainment compared to natives in 2010, but this gap narrowed by 2024.