

Summary
- Employment rates of immigrants in the EU reached their highest levels since 2017 for all origin groups in 2025. The strongest improvement was among non-EU immigrants, from 59.4% in 2017 to 66.0% in 2025. Still, their employment rate remained below that of natives (71.6%) and EU immigrants (74.8%).
- EU immigrants generally matched or exceeded native employment rates across Member States. By contrast, non-EU immigrants experienced much larger cross-country differences, ranging from employment rates above 75% in Malta, Czechia and Ireland to below 60% in Belgium and Finland.
- The employment gap between natives and non-EU immigrants is driven primarily by women. By 2025, non-EU immigrant men had almost reached the employment rate of native men, while non-EU immigrant women continued to have substantially lower rates, particularly in Greece and Italy.
- Higher education is associated with higher employment rates for all groups, but highly educated non-EU immigrants remain substantially less likely to be employed than equally educated natives across much of Europe.
This report examines employment among the working-age population (15–64 years) in the European Union using aggregated Eurostat data. It compares employment rates between natives, EU-born immigrants, and non-EU-born immigrants, and explores how these differences vary across Member States, gender, and educational attainment. The analysis by educational attainment focuses on individuals aged 25–64. Immigrants are defined as individuals born in a country other than their country of residence. EU immigrants are individuals born in another EU Member State, while non-EU immigrants are individuals born outside the EU.
Employment Rates Have Increased Across All Population Groups Since 2017
Employment rates increased across both immigrants and natives between 2017 and 2025. Non-EU immigrants experienced the largest increase, narrowing part of the employment gap with natives, but remained the group with the lowest employment rates throughout the period.
Figure 1 traces employment rates between 2017 and 2025 for natives, EU-born immigrants, and non-EU-born immigrants across the EU. Among the foreign-born working-age population, around one quarter were born in another EU Member State, while three quarters were born outside the EU in 2025. Employment rates increased for all three groups over the period.
EU immigrants consistently recorded the highest employment rates throughout the entire period, increasing from 71.1% in 2017 to 74.8% in 2025, and remaining above that of natives in every year. Most of this increase took place between 2020 and 2022, after which it stabilised at around 75%.
Among natives, the employment rate rose from 67.2% to 71.6% between 2017 and 2025, reaching its highest level of the period in 2025.
The largest increase occurred among non-EU immigrants. Their employment rate increased by 6.6 percentage points, from 59.4% in 2017 to 66.0% in 2025. Although they remained the group with the lowest employment rate throughout the period, they closed part of the gap with natives (See Figure A.1 in the Appendix Figures for the corresponding employment rate gaps relative to natives).
Figure 1
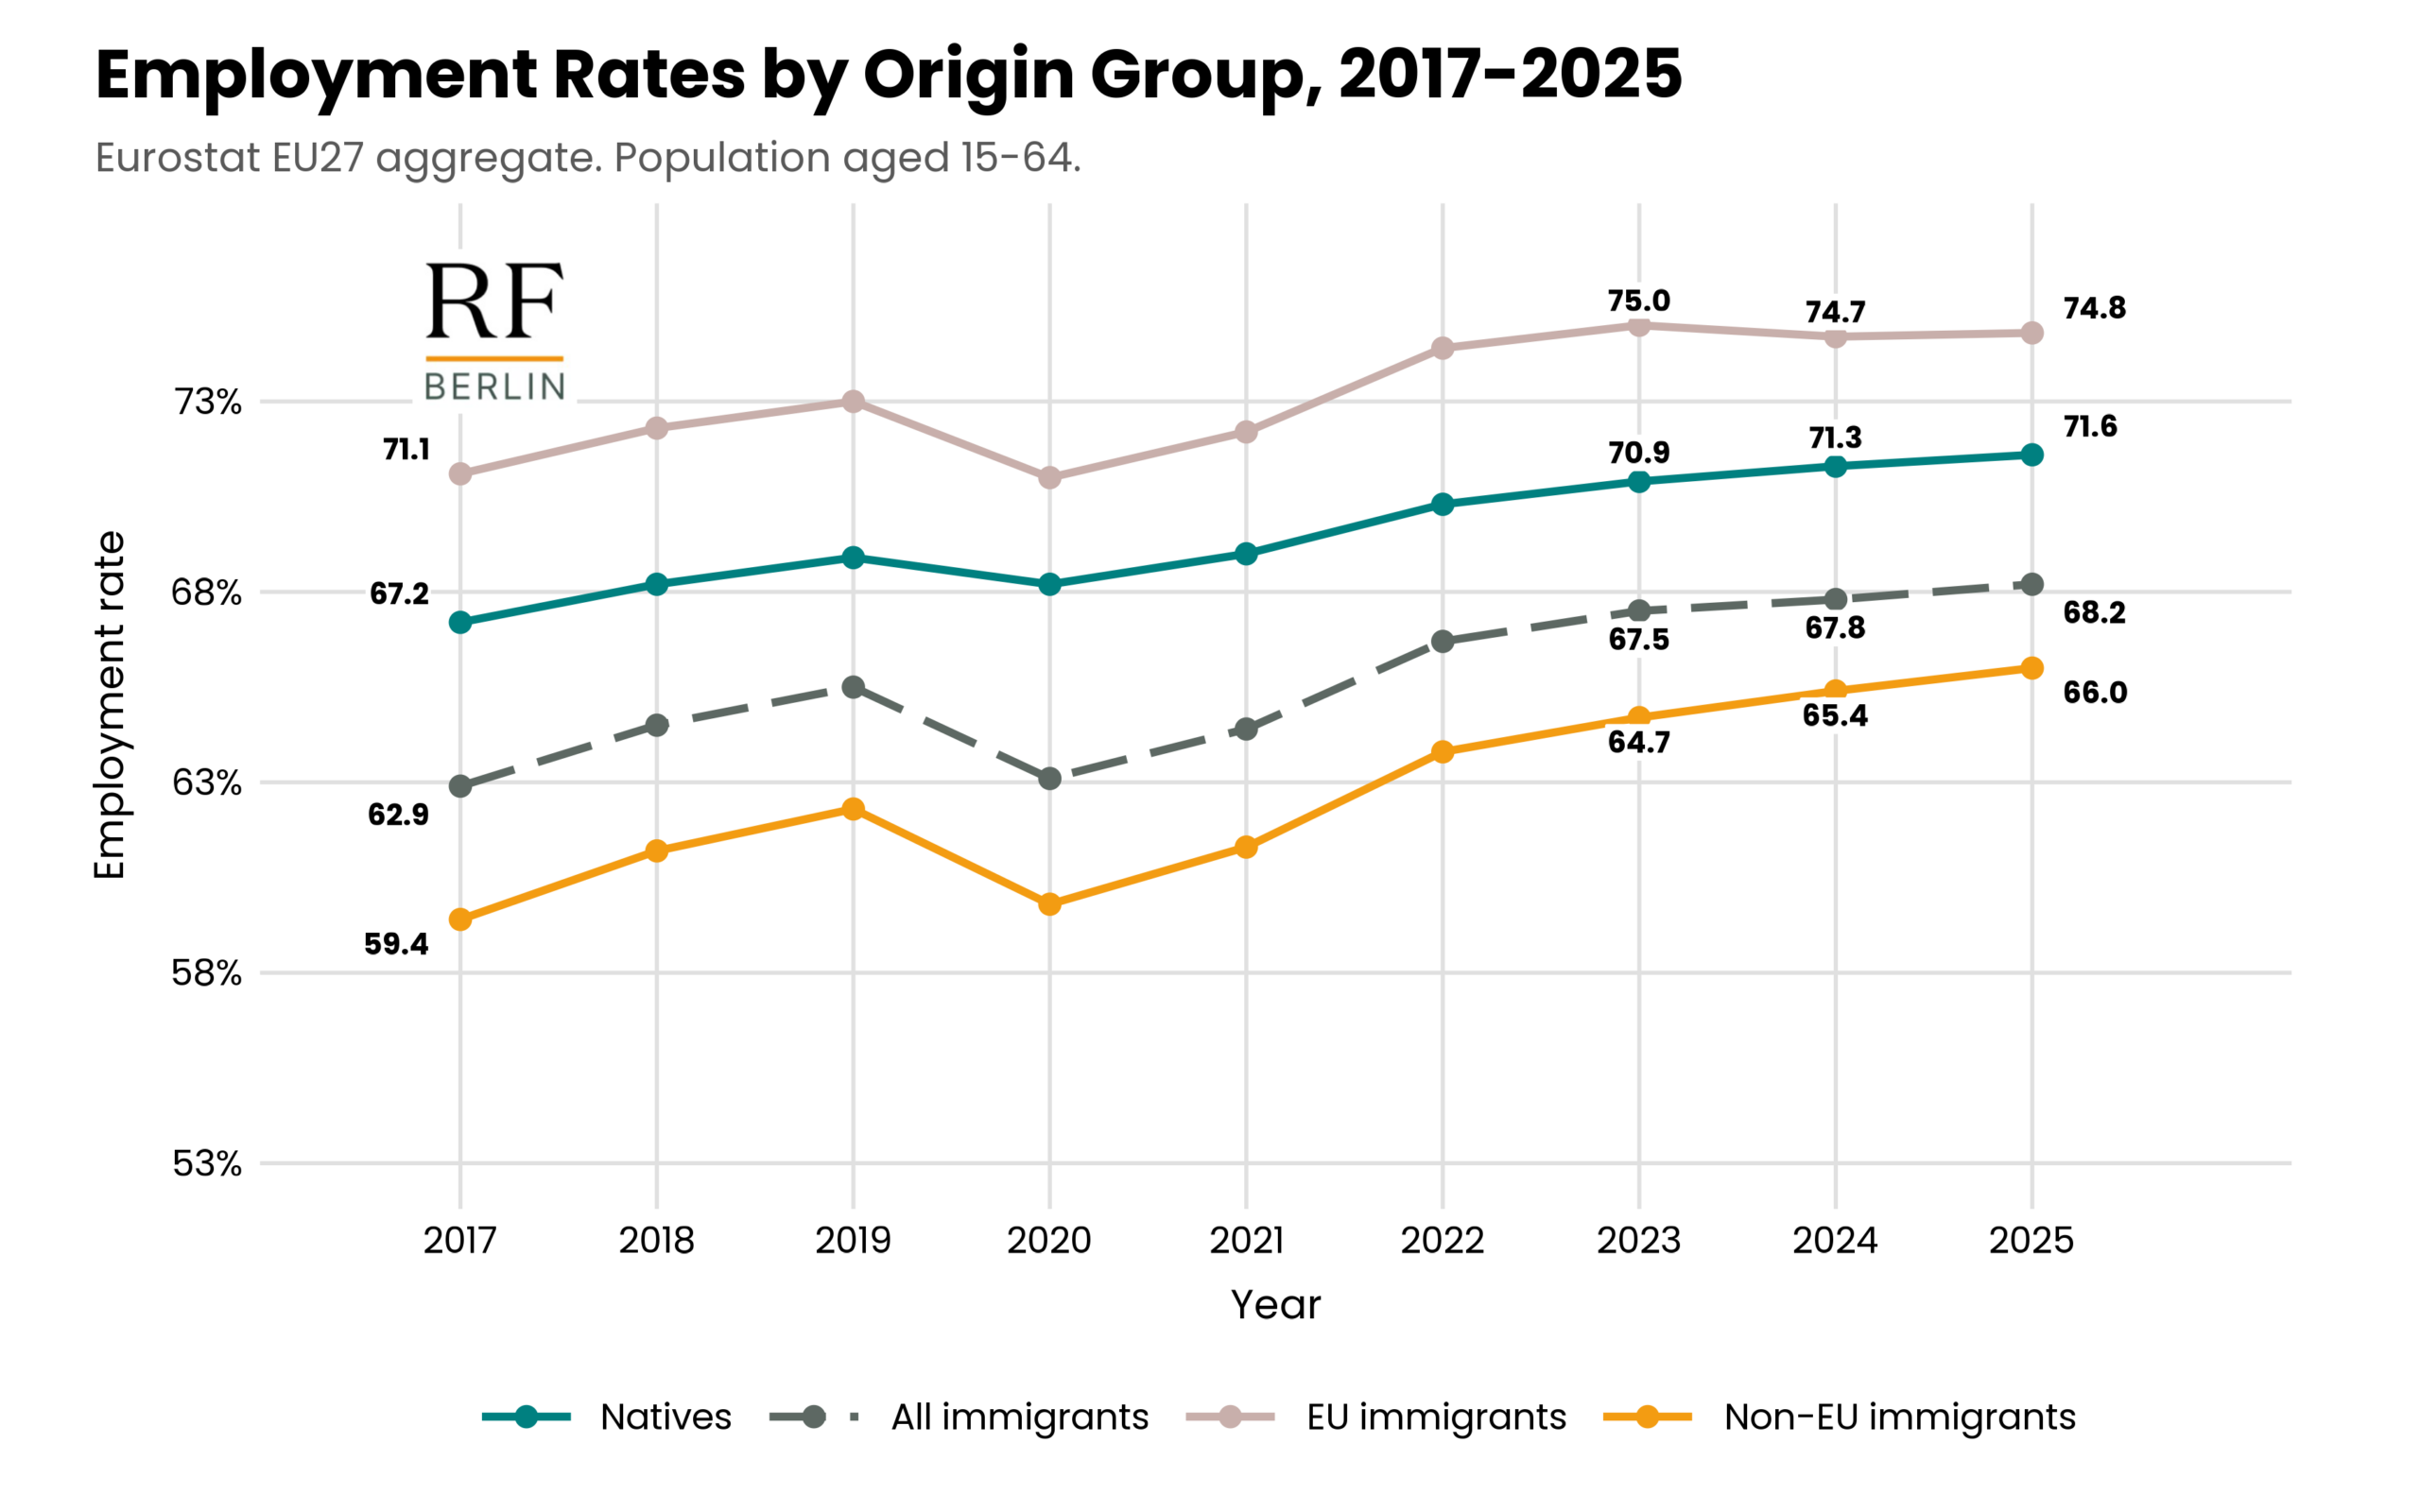
Source: Own computation based on data from Eurostat, LFSA_ERGAEDCOB (downloaded on 6 July 2026). Notes: Employment rate in the European Union for different demographic groups. The employment rate is the share of employed individuals in the population aged 15 to 64 for the respective group. Immigrants are defined as individuals born in a country other than the one in which they reside. The European Union includes all 27 European Member States as of February 1st, 2020.
EU Immigrants Frequently Match or Exceed Native Employment Rates
Employment outcomes for EU immigrants are remarkably similar to those of natives across most Member States. By contrast, employment outcomes for non-EU immigrants vary widely across countries, with the largest employment gaps occurring where native employment rates are highest.
Although employment rates have increased across all population groups, differences between immigrants and natives vary considerably across Member States. Figure 2 compares immigrant employment rates with those of natives and relates these differences to the employment rate of the native-born population.
Figure 2
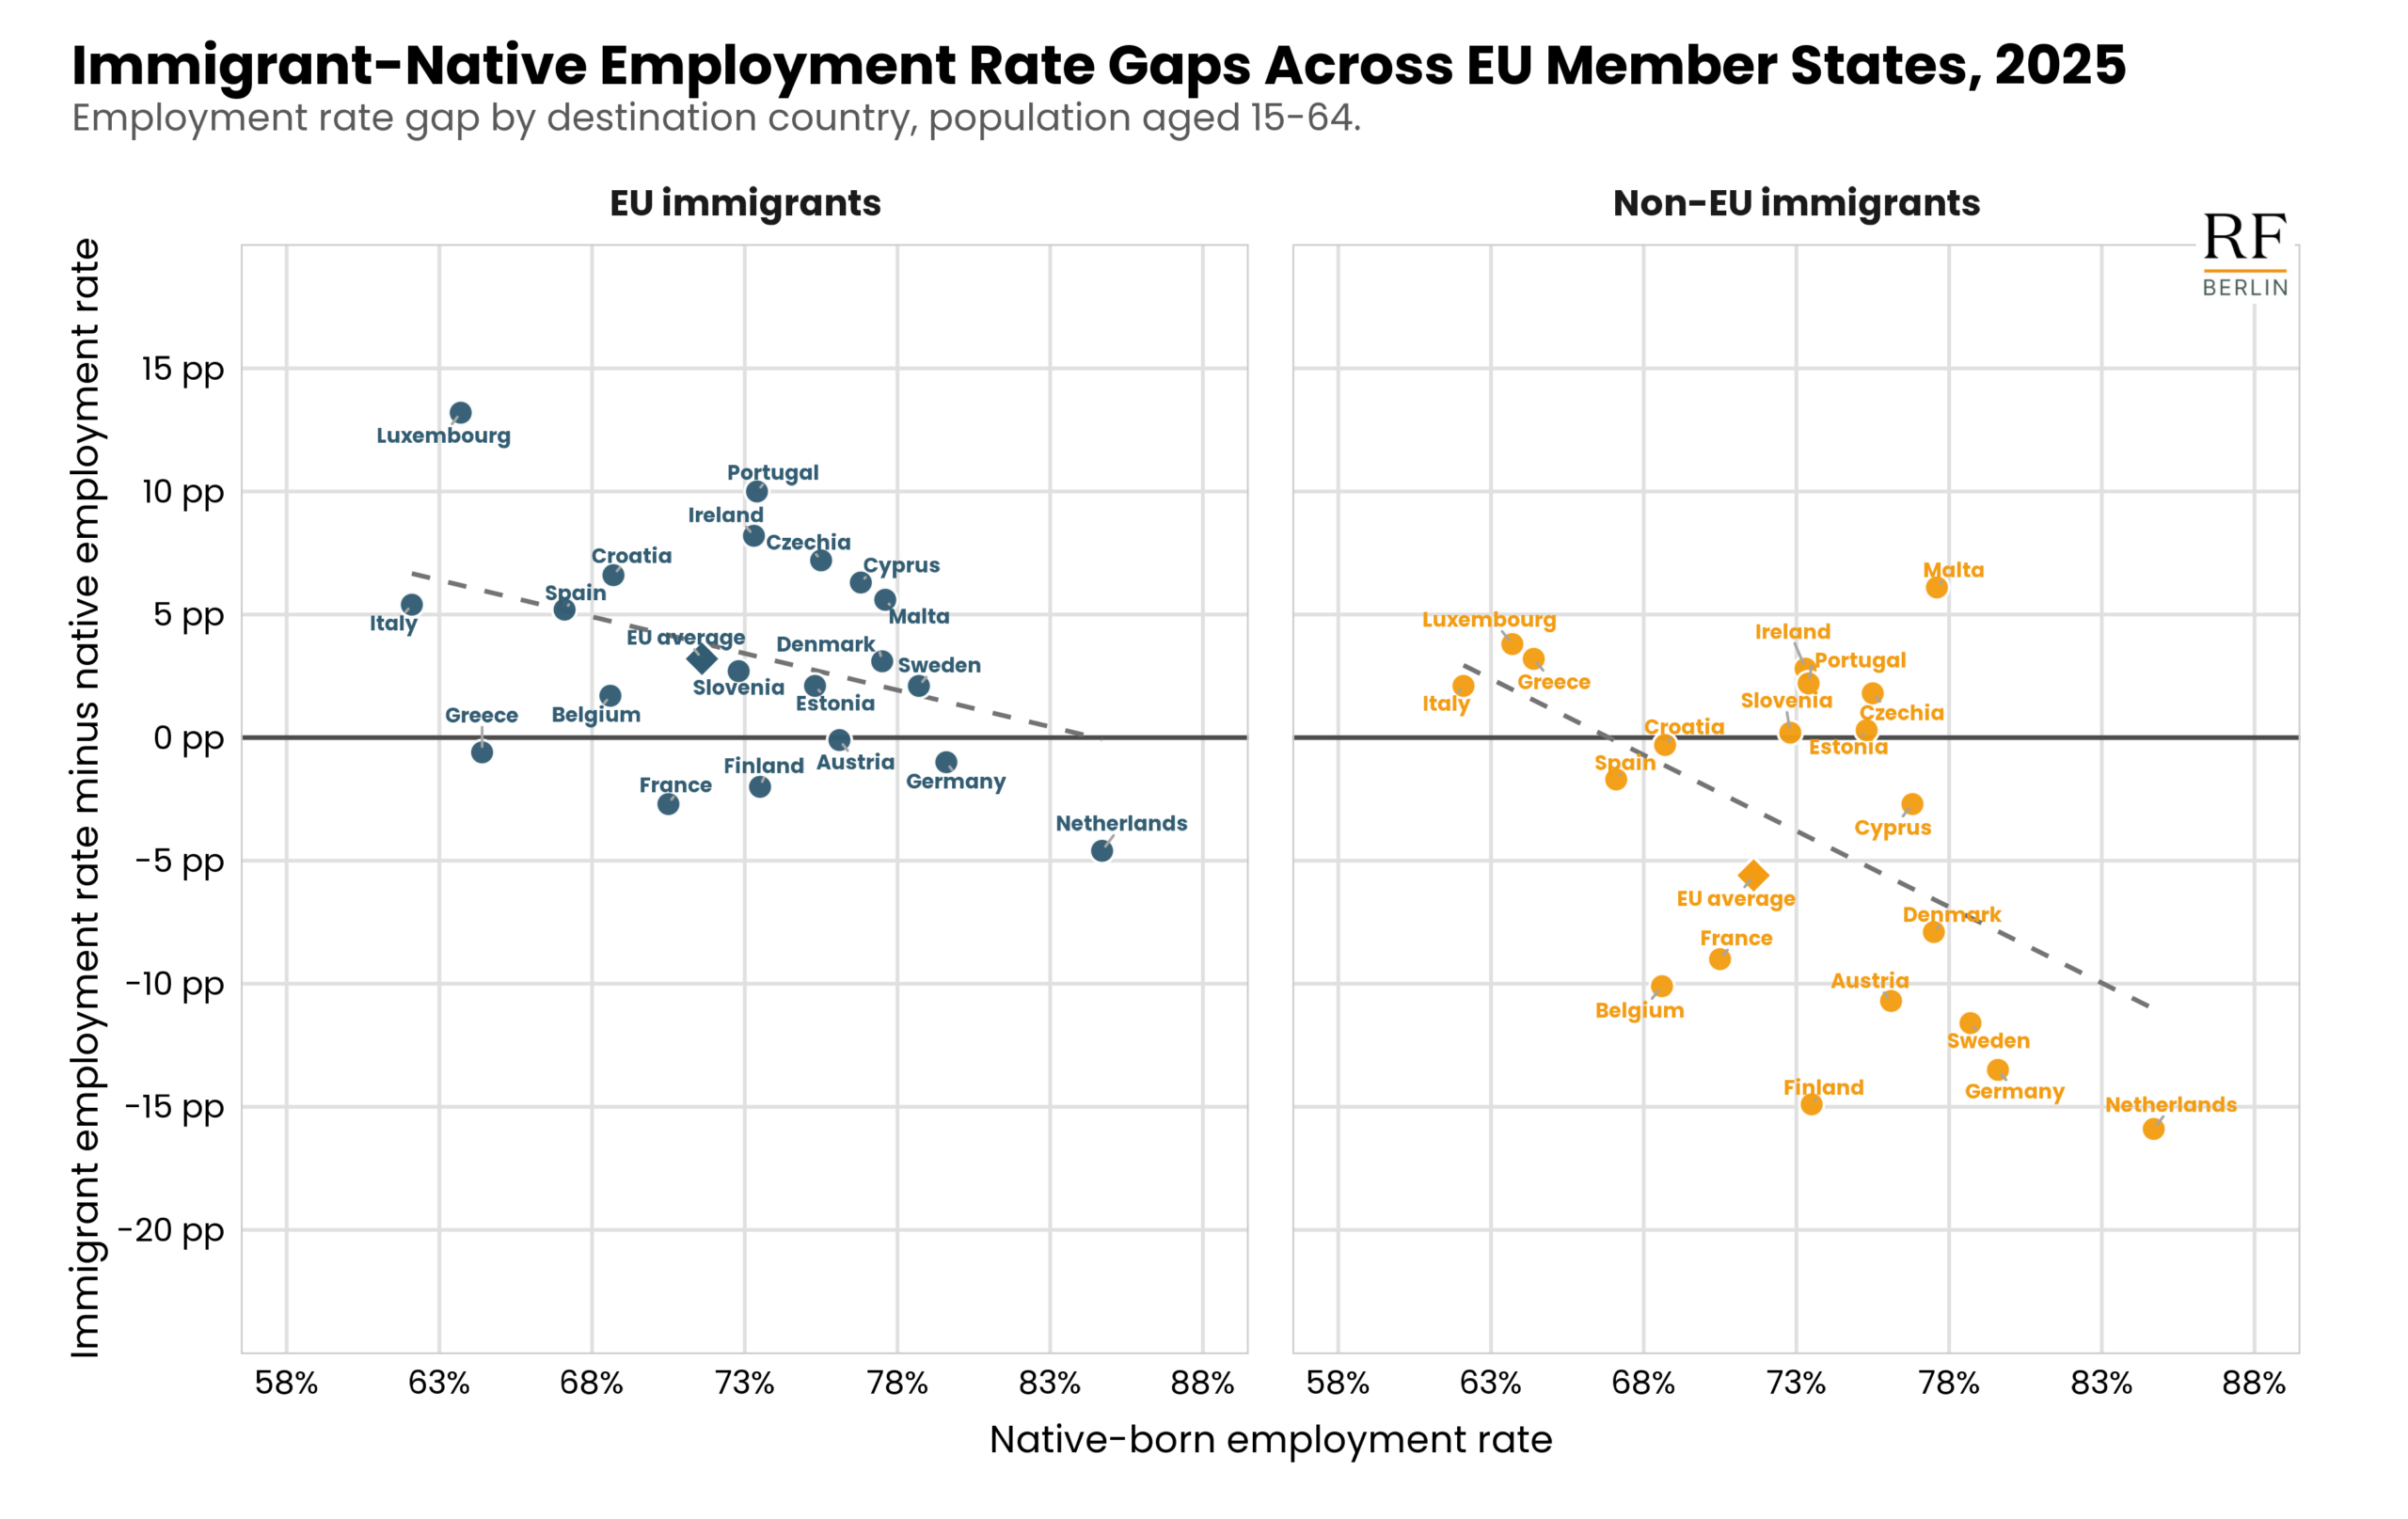
Source: Own computation based on data from Eurostat, LFSA_ERGAEDCOB (downloaded on 6 July 2026). Notes: Difference between immigrant and native-born employment rates by country of birth. Positive values indicate that immigrants have higher employment rates than native-born individuals; negative values indicate lower employment rates. Employment rates refer to the share of employed individuals in the population aged 15 to 64 for the respective group. Immigrants are defined as individuals born in a country other than their country of residence. The dashed line shows a linear fit across included countries; the diamond marks the EU average. The country-level analysis includes EU countries where immigrants account for at least 10% of the working-age population in 2025.
Among EU-born immigrants (Figure 2, left panel), employment outcomes are generally similar to those of natives. In several countries, including Croatia, Cyprus, Czechia, Ireland, Luxembourg, Malta and Portugal, EU immigrants exhibit higher employment rates than the native-born population, while only a few countries – notably the Netherlands, Germany, Finland and France – record employment rates for EU immigrants that are more than 1 percentage point lower than natives. Overall, differences in employment rates between EU-born immigrants and the native-born population are relatively small in most countries.
The picture is markedly different for non-EU immigrants (Figure 2, right panel). Employment gaps are substantially larger and vary much more across countries. While non-EU immigrants achieve employment rates similar to, or above, those of natives in countries such as Malta, Luxembourg, Ireland and Greece, they face sizeable employment disadvantages in the Netherlands, Germany, Sweden and Finland.
A second pattern emerges from Figure 2. Across countries, the employment gap between immigrants and natives is generally associated with larger employment gaps between immigrants and natives. This relationship is particularly pronounced for non-EU immigrants, as illustrated by the downward-sloping fitted line. The Netherlands and Germany combine some of the highest native employment rates with some of the largest employment disadvantages for non-EU immigrants. By contrast, Luxembourg, Greece and Italy have lower native employment rates and a small employment advantage for non-EU immigrants, meaning that their employment rates exceed those of natives.
Table 1 reports the underlying employment rates behind these gaps, showing that employment rates among non-EU immigrants are not uniformly low across Member States. In Malta, Czechia, Ireland, Estonia and Portugal, employment rates among non-EU immigrants exceed 75%, and EU immigrants also record high employment rates. By contrast, Finland, Belgium, France and Germany record much lower employment rates among non-EU immigrants, despite relatively high rates among natives. The table therefore reinforces the pattern shown in Figure 2: differences between immigrants and natives reflect both employment outcomes among immigrants and the employment benchmark set by the native-born population.
Table 1
| Country | Non-EU immigrants (%) | Natives (%) | EU immigrants (%) |
| Malta | 83.7 | 77.6 | 83.2 |
| Czechia | 77.3 | 75.5 | 82.7 |
| Ireland | 76.1 | 73.3 | 81.5 |
| Estonia | 75.6 | 75.3 | 77.4 |
| Portugal | 75.6 | 73.4 | 83.4 |
| Cyprus | 74.1 | 76.8 | 83.1 |
| Slovenia | 73.0 | 72.8 | 75.5 |
| Denmark | 69.6 | 77.5 | 80.6 |
| Netherlands | 68.8 | 84.7 | 80.1 |
| Croatia | 68.4 | 68.7 | 75.3 |
| Greece | 67.6 | 64.4 | 63.8 |
| Luxembourg | 67.5 | 63.7 | 76.9 |
| Sweden | 67.1 | 78.7 | 80.8 |
| Germany | 66.1 | 79.6 | 78.6 |
| Austria | 65.4 | 76.1 | 76.0 |
| Spain | 65.4 | 67.1 | 72.3 |
| Italy | 64.2 | 62.1 | 67.5 |
| France | 61.5 | 70.5 | 67.8 |
| Finland | 58.6 | 73.5 | 71.5 |
| Belgium | 58.5 | 68.6 | 70.3 |
Source: Own computation based on data from Eurostat, LFSA_ERGAEDCOB (downloaded on 6 July 2026). Notes: Employment rates by country and country of birth in 2025. Employment rates refer to the share of employed individuals in the population aged 15 to 64 for the respective group. Countries are sorted by employment rates for non-EU immigrants.
Although country differences are substantial, two additional dimensions consistently explain much of the variation across Europe: gender and educational attainment.
Gender Remains the Largest Source of Employment Inequality
Gender is one of the largest sources of employment inequality among immigrants. While non-EU immigrant men have largely caught up with native men, large and persistent employment gaps remain among women, with some Member States exhibiting exceptionally wide gender disparities.
Among people aged 15–64, women account for 49.5% of the native-born population, compared with 52.6% of EU immigrants and 50.8% of non-EU immigrants. By 2025, employment rates for men had largely converged across origin groups (Figure 3, left panel). While EU immigrant men continued to record the highest employment rate (80.5%), non-EU immigrant men (74.9%) had almost reached the employment level of native men (75.2%).
In contrast, employment outcomes among women varied much more by origin (Figure 3, right panel). Non-EU immigrant women remained well below both native women and EU immigrant women, despite steady improvements in recent years. As a result, the gender employment gap remained more than twice as large among non-EU immigrants (17.5 percentage points) as among natives (7.3 points).
Figure 3
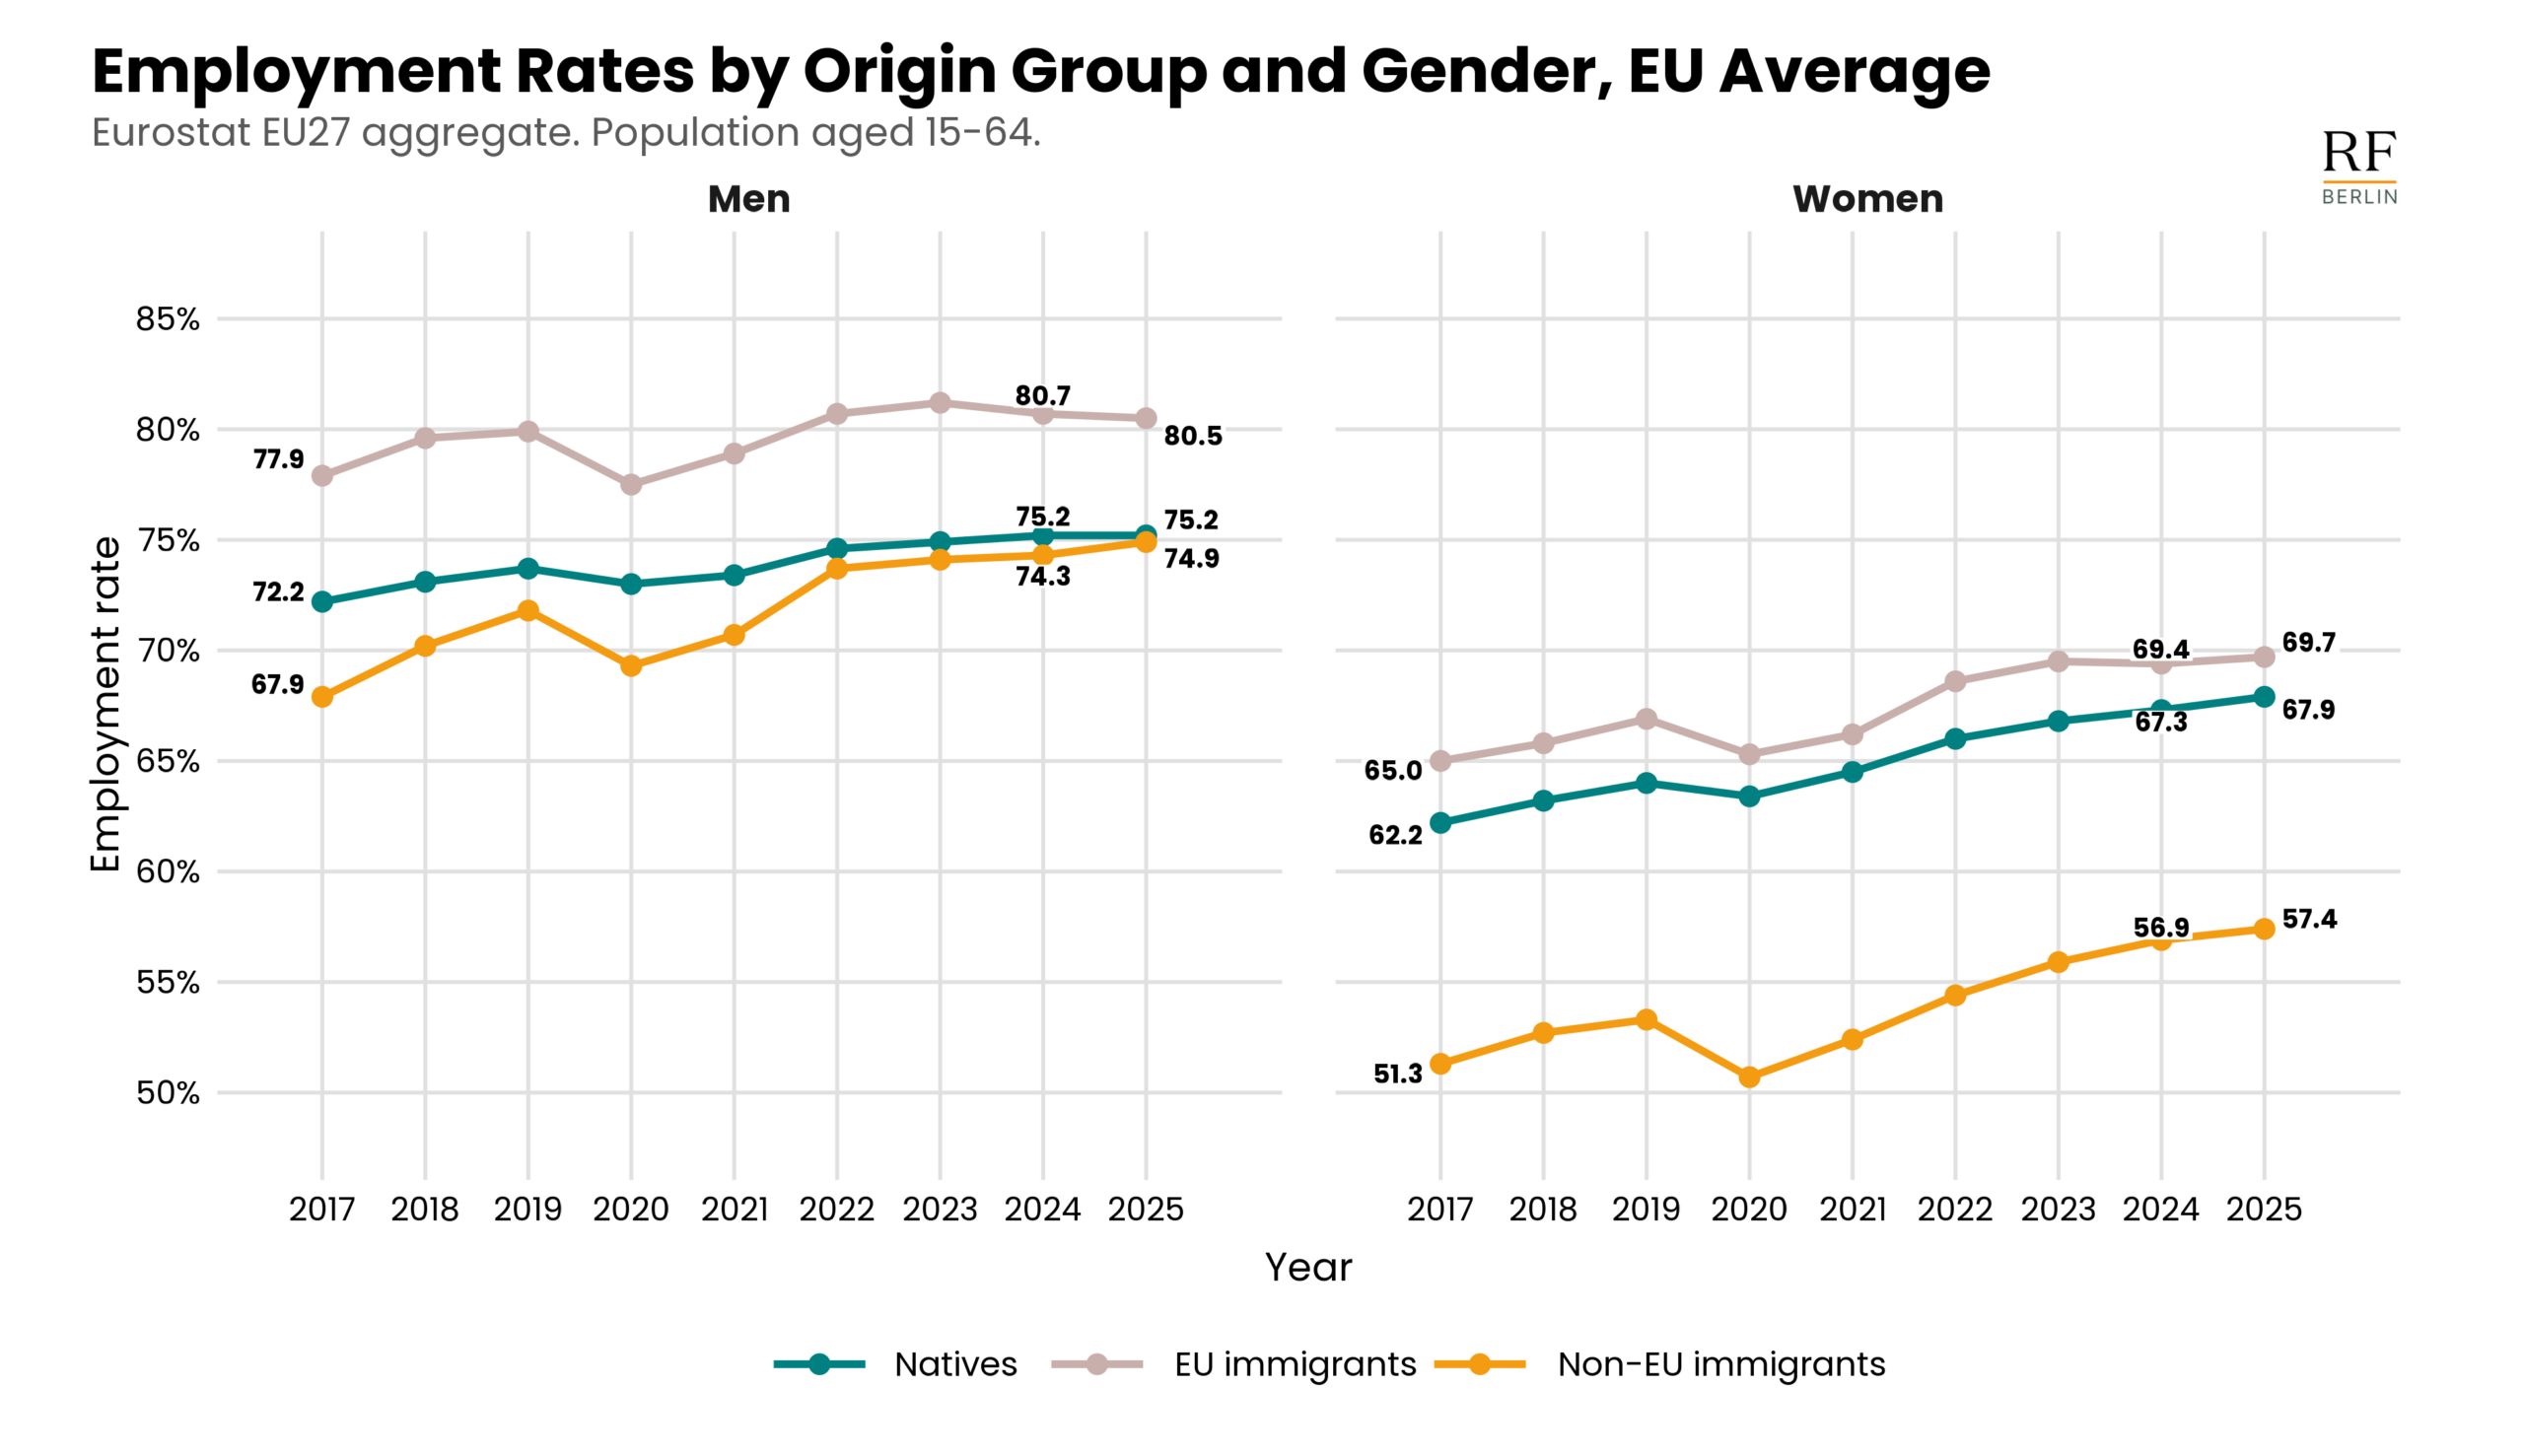
Source: Own computation based on data from Eurostat, LFSA_ERGAEDCOB (downloaded on 6 July 2026). Notes: Average employment rate in the European Union for different demographic groups by gender. Employment rates refer to the share of employed individuals in the population aged 15 to 64 for the respective group. Immigrants are defined as individuals born in a country other than their country of residence. EU immigrants are individuals born in another EU Member State, while non-EU immigrants are individuals born outside the EU. The European Union includes all 27 Member States as of February 1st, 2020.
The EU average, however, conceals substantial variation across countries. Because non-EU immigrants exhibit by far the largest gender gap, Figure 4 focuses on this group to examine how gender differences in employment rates vary across Member States. Comparable figures for natives and EU immigrants are provided in Appendix Figure A.2 and Figure A.3.
The figure reveals striking differences across countries. Greece records by far the largest gender gap, with employment rates of 83.9% among non-EU immigrant men and only 51.0% among women, a difference of almost 33 percentage points. Large gaps are also observed in Italy (79.7% versus 48.5%) and Slovenia (83.4% versus 60.5%). By contrast, Portugal (80.4% versus 71.3%), Estonia (80.8% versus 71.0%), Cyprus (79.8% versus 69.6%), and Denmark (74.8% versus 64.5%) display considerably smaller differences between women and men.
Figure 4
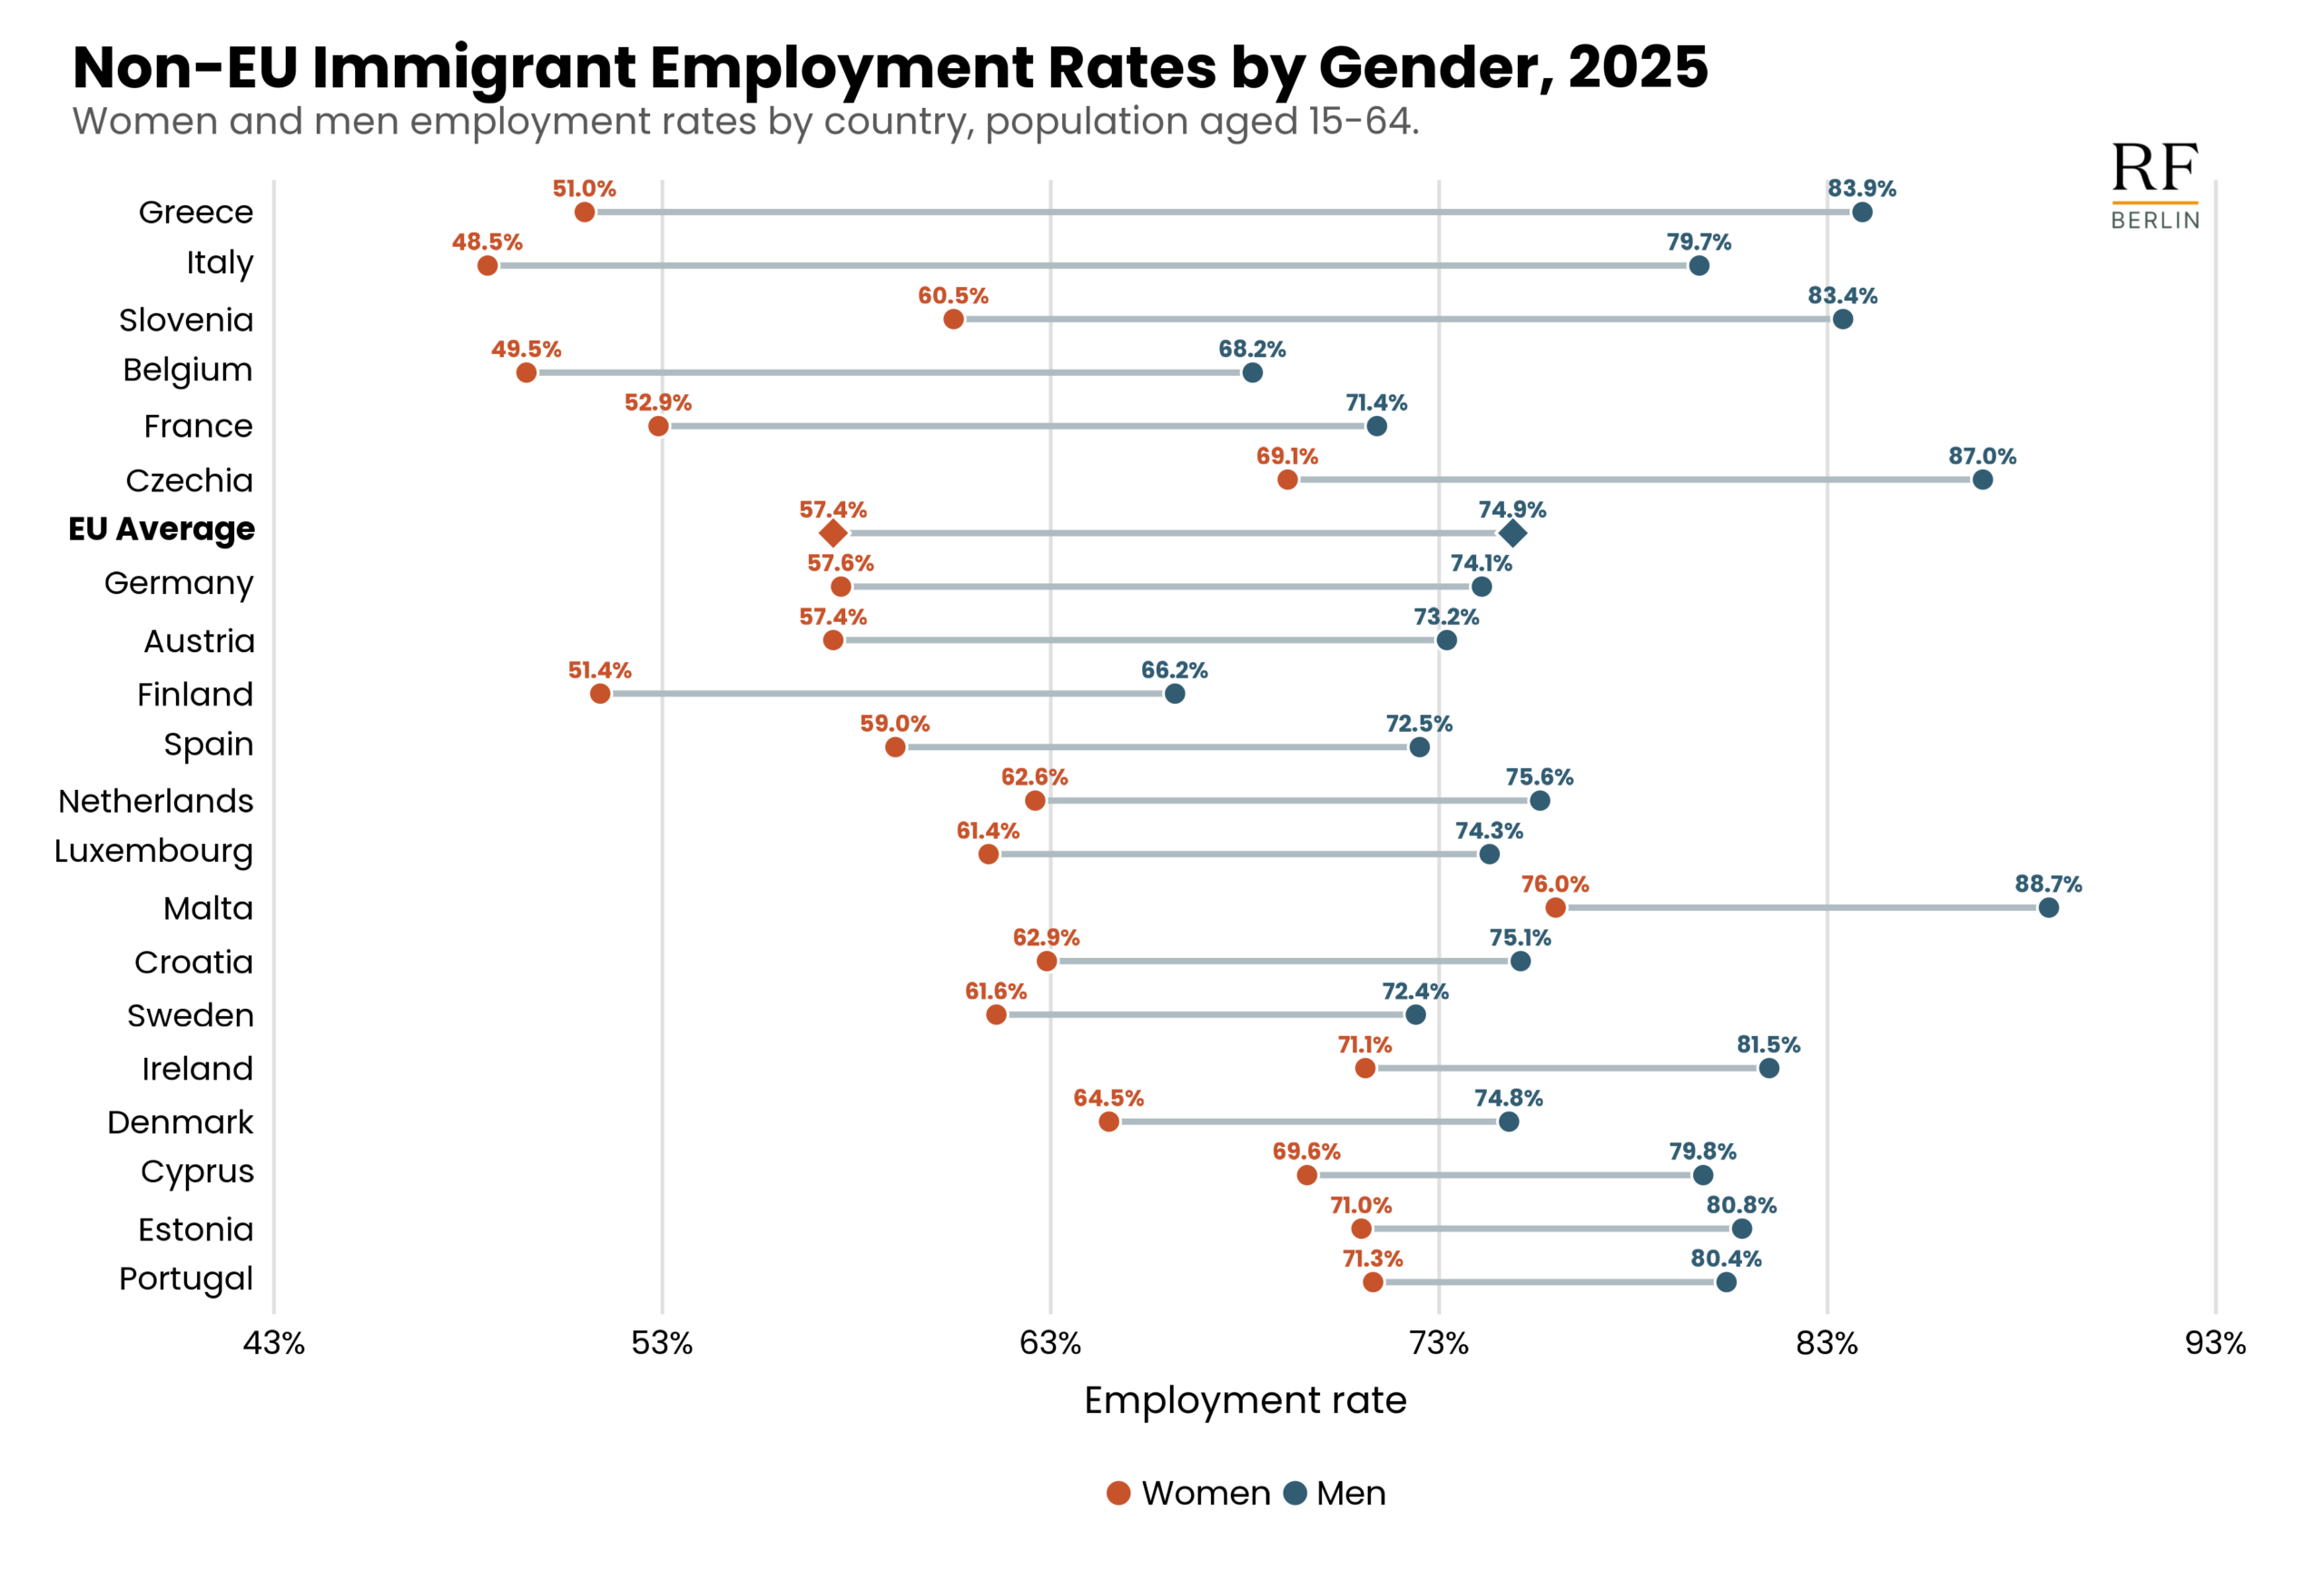
Source: Own computation based on data from Eurostat, LFSA_ERGAEDCOB (downloaded on 6 July 2026). Notes: Employment rates of non-EU immigrant women and men by country in 2025. Employment rates refer to the share of employed individuals in the population aged 15 to 64 for the respective group. Countries are sorted by the gender gap, measured as men’s employment rate minus women’s employment rate. Point labels show employment rates; diamonds mark the EU average. The country-level analysis includes EU countries where immigrants account for at least 10% of the working-age population in 2025.
Education is Less Strongly Linked to Employment for Non-EU Immigrants
Education is associated with better employment outcomes across Europe, but the association differs markedly by origin. For non-EU immigrants, higher educational attainment does not translate into the same employment advantages observed among natives and EU immigrants, particularly in countries where low-skilled migrant employment rate is comparatively strong.
Beyond gender, educational attainment is another key dimension of labour market integration. To examine this aspect, we focus on individuals aged 25–64, an age range in which most people have completed their education. Among EU immigrants aged 25–64, 24.0% had a low level of education, 40.0% had a medium level, and 36.0% had a high level. Among non-EU immigrants, the corresponding shares were 35.3%, 32.2%, and 32.5%, respectively.
Figure 5 shows employment rates by education, origin group, and gender in the European Union in 2025 (See the explanation of education categories in the Technical Appendix). Across all origin groups, employment rates increase with educational attainment for both women and men. However, the strength of this relationship varies markedly by immigrants’ origin.
Among natives, employment rates rise steeply with education. For men, the employment rate increases from 67.8% among those with low education to 91.5% among the highly educated. Among women, the corresponding increase is even larger, from 45.9% to 88.2%. A very similar pattern is observed among EU immigrants, where the employment rate rises from 77.9% to 90.6% for men and from 57.6% to 83.6% for women. These figures indicate that higher educational attainment is consistently associated with high employment rates among both natives and EU immigrants.
For non-EU immigrants, employment rates also rise with education, but the increase in employment rate associated with higher educational attainment is smaller than among natives and EU immigrants. Among men, the rate increases by 10.7 percentage points between low and high education, from 74.1% to 84.8%, while among women it increases by 22.8 percentage points, from 46.8% to 69.6%. These results suggest that although employment rates increase with educational attainment among non-EU immigrants, their employment disadvantage persists, particularly among women. Highly educated non-EU immigrant women remain far below highly educated native and EU immigrant women.
Figure 5
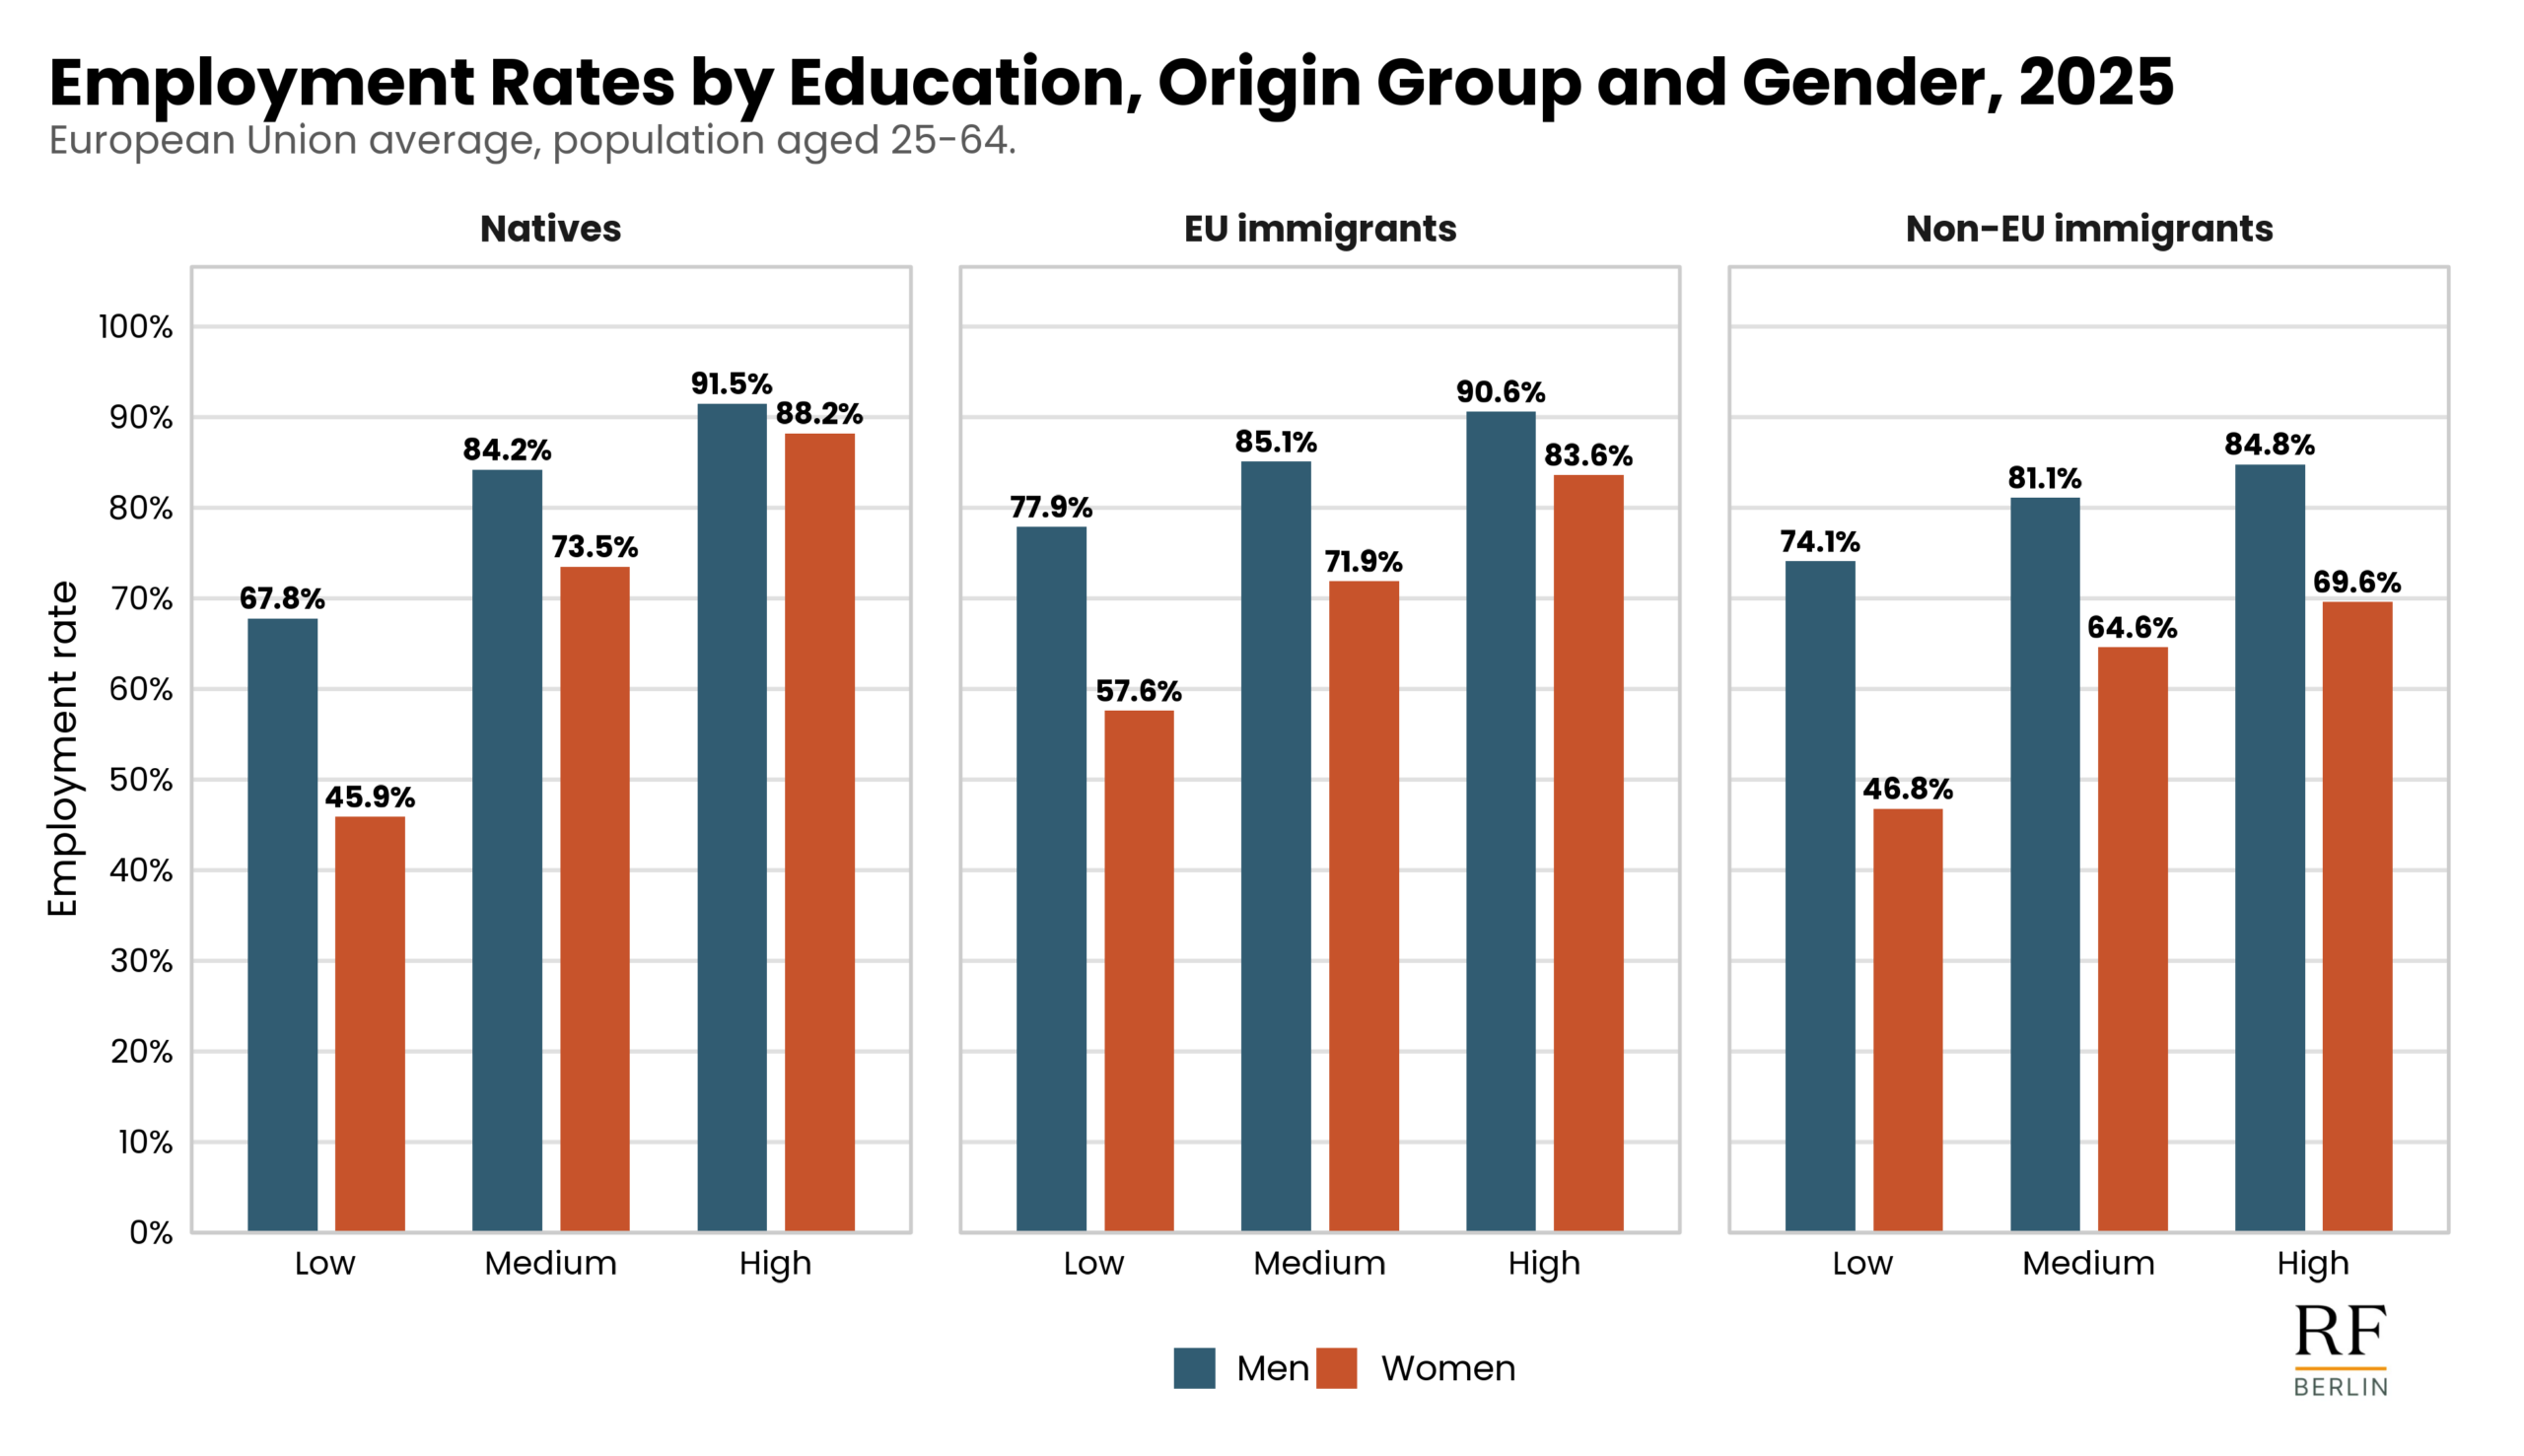
Source: Own computation based on data from Eurostat, LFSA_ERGAEDCOB (downloaded on 6 July 2026). Notes: Employment rates by education, origin group, and gender in 2025. Employment rates refer to the share of employed individuals in the population aged 25 to 64 for the respective group.
Figure 6 reveals a striking contrast in employment outcomes by educational attainment. Across most Member States, highly educated non-EU immigrants are less likely to be employed than highly educated natives, whereas low-educated non-EU immigrants often exhibit higher employment rates than their native counterparts.
Figure 6
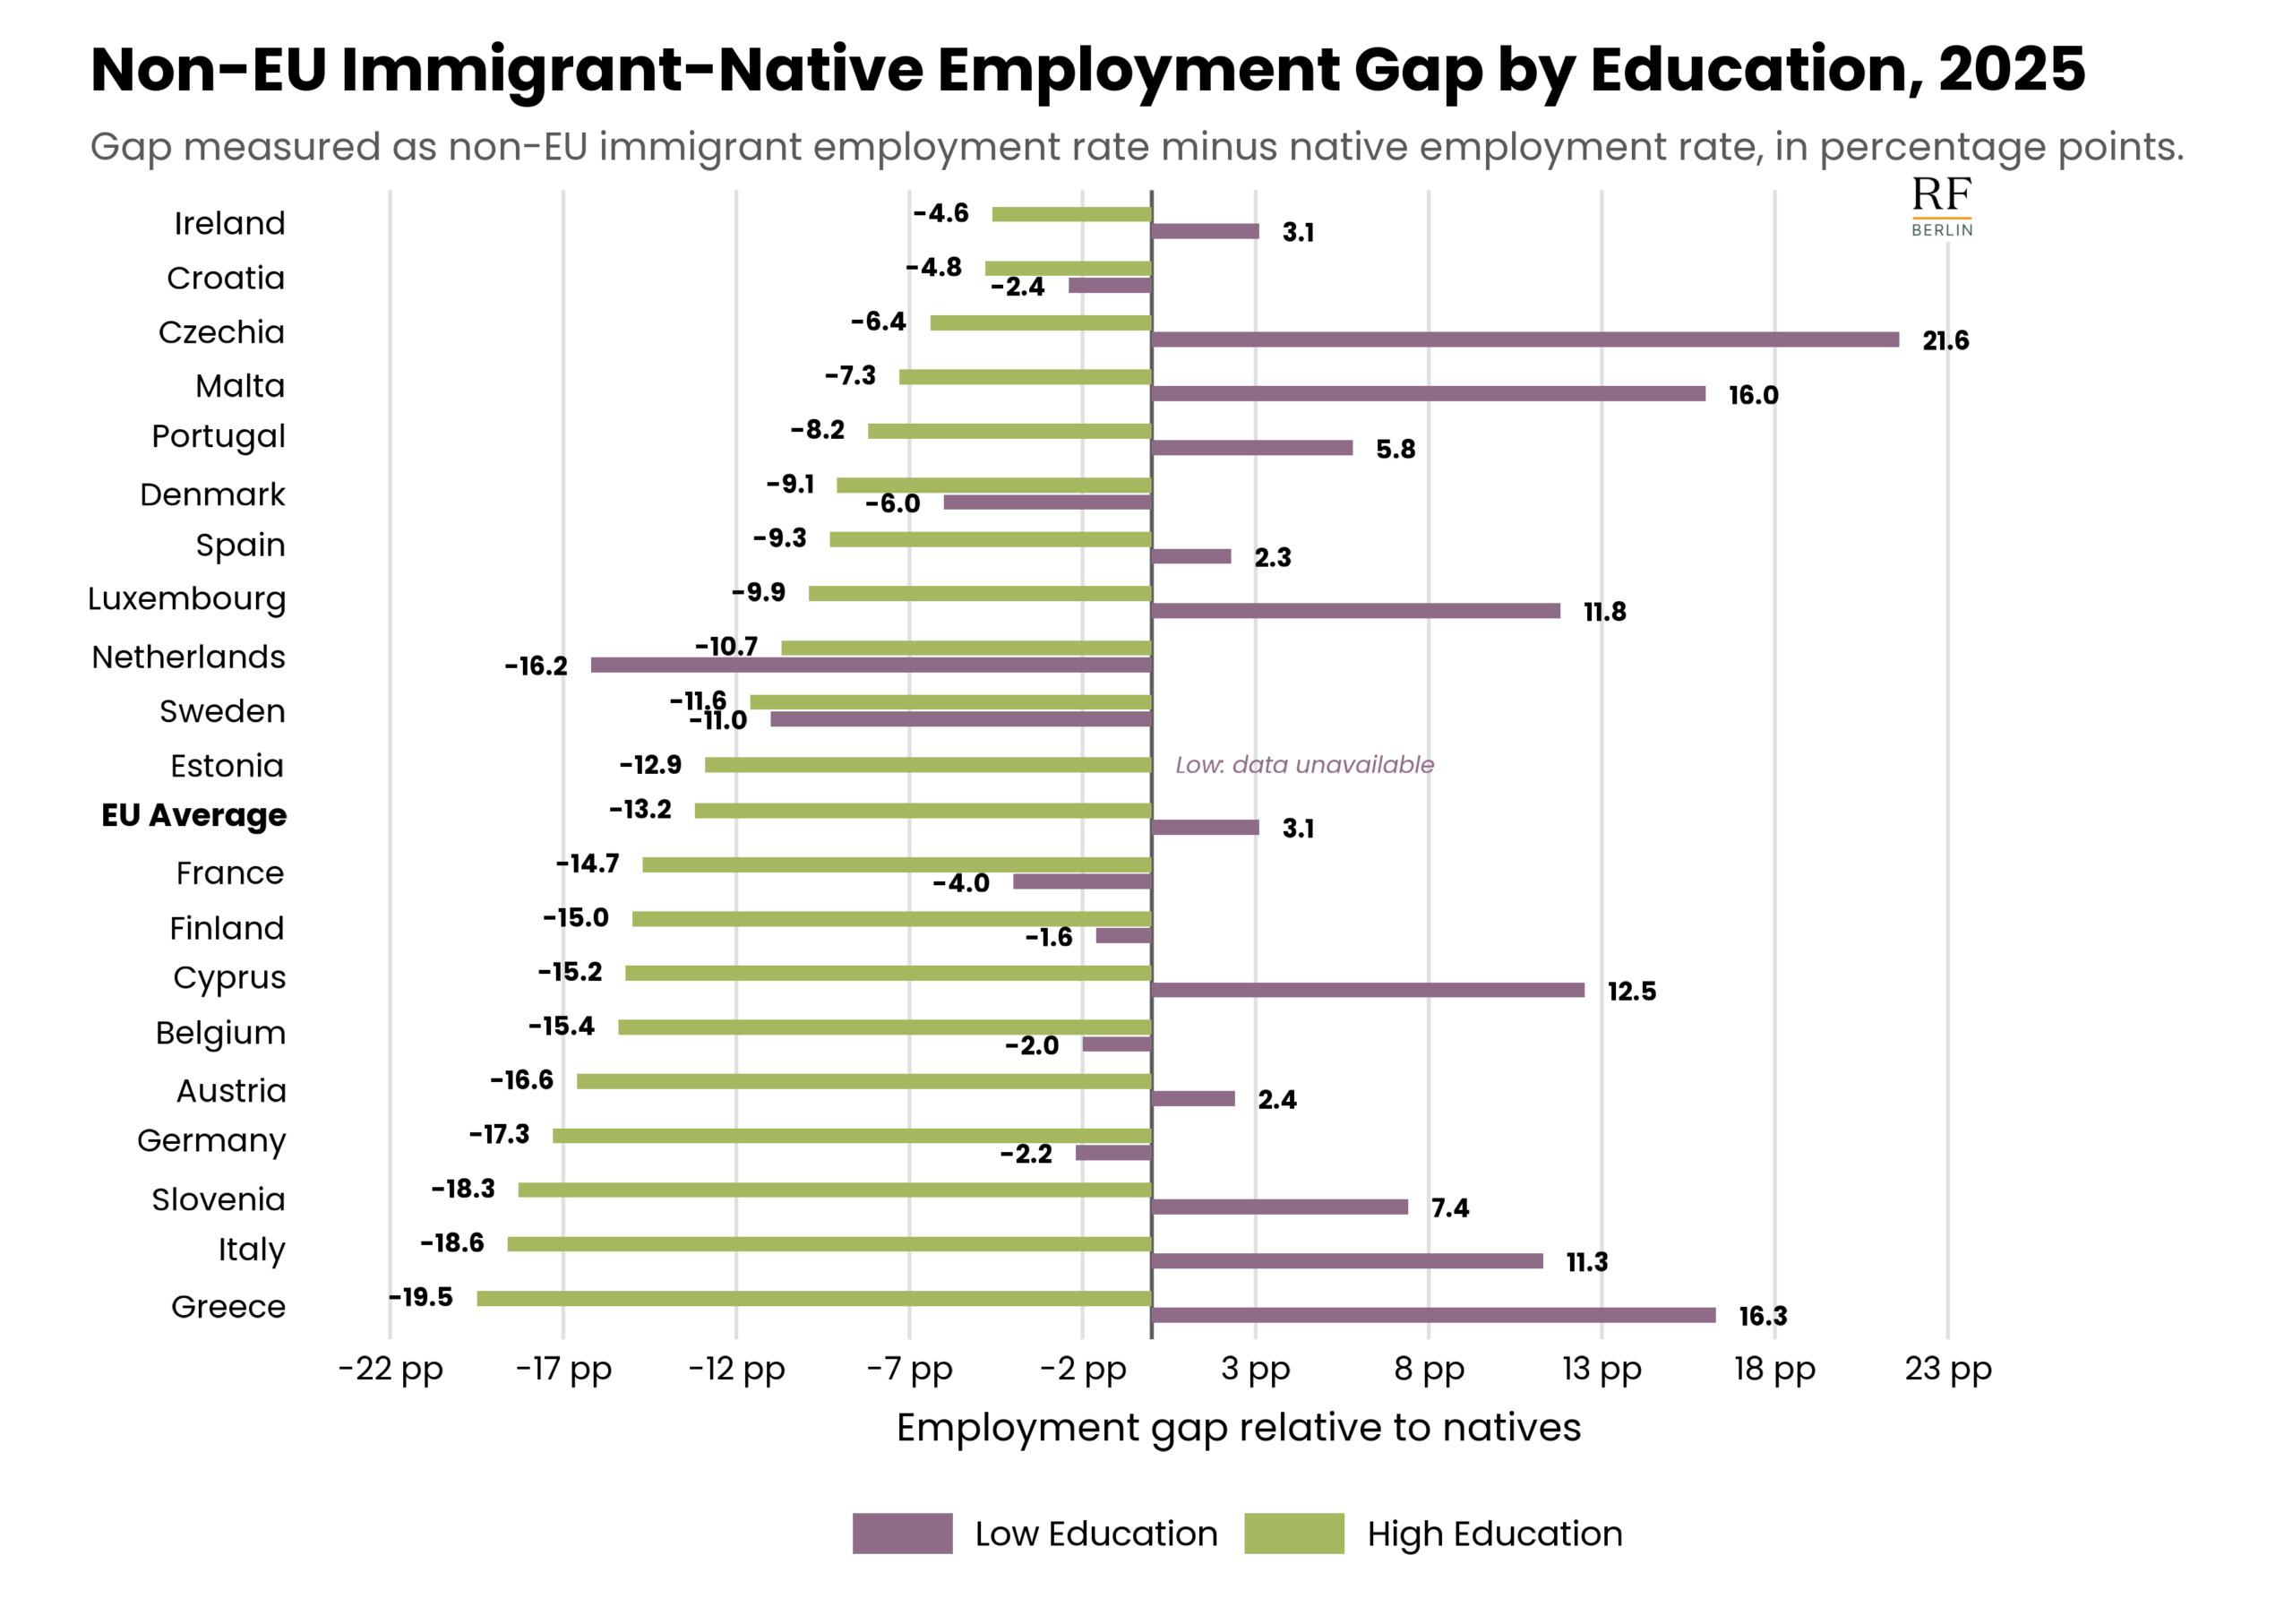
Source: Own computation based on data from Eurostat, LFSA_ERGAEDCOB (downloaded on 6 July 2026). Notes: Employment rate gap between non-EU immigrants and natives in 2025 by educational attainment. Employment rates refer to the share of employed individuals aged 25–64 within each education group. Positive values indicate that non-EU immigrants have higher employment rates than natives, while negative values indicate lower employment rates. Countries are ranked according to the employment-rate gap among the highly educated, from the smallest to the largest gap. The country-level analysis includes EU Member States where immigrants accounted for at least 10% of the working-age population in 2025.
This pattern is particularly pronounced in Greece, where low-educated non-EU immigrants are 16.3 percentage points more likely to be employed than low-educated natives, whereas highly educated non-EU immigrants are 19.5 percentage points less likely to be employed than highly educated natives. Similar patterns emerge in Czechia (+21.6 versus –6.4 percentage points), Malta (+16.0 versus –7.3 percentage points), Cyprus (+12.5 versus –15.2 percentage points), Italy (+11.3 versus –18.6 percentage points) and Slovenia (+7.4 versus −18.3 percentage points).
By contrast, countries such as Denmark, the Netherlands, Sweden, France and, to a lesser extent, Croatia, Finland, Belgium, and Germany, display negative employment gaps for both low- and highly educated workers, indicating that non-EU immigrants have lower employment rates than natives regardless of educational attainment.
In several countries, non-EU immigrants are more successful in accessing lower-skilled employment while remaining substantially disadvantaged in higher-skilled segments of the labour market. This pattern is consistent with evidence of under-recognition of foreign qualifications, occupational mismatch and the overqualification of highly educated immigrants, particularly those educated outside the European Union (Dustmann et al., 2013, OECD, 2017; Frattini & Dalmonte, 2024).
Greece: An Exception to the Education–Employment Association
Despite a relatively high employment rate among non-EU immigrants, Greece reveals one of the strongest contrasts in employment outcomes by educational attainment. Among non-EU immigrants, the employment rate is highest for the low educated and declines with education – the opposite of the pattern observed among natives and EU immigrants.
Greece provides a particularly striking illustration of the relationship between education and employment among non-EU immigrants. Figure 7 shows that, unlike among natives and EU immigrants, the employment rate among non-EU immigrants does not increase with educational attainment. While it rises from 57.0% to 83.5% among natives and from 46.1% to 73.7% among EU immigrants as education increases, the opposite pattern is observed among non-EU immigrants. The employment rate is highest among those with low education (73.3%) and declines slightly for medium- (67.5%) and highly educated (64.0%) individuals.
Figure 7
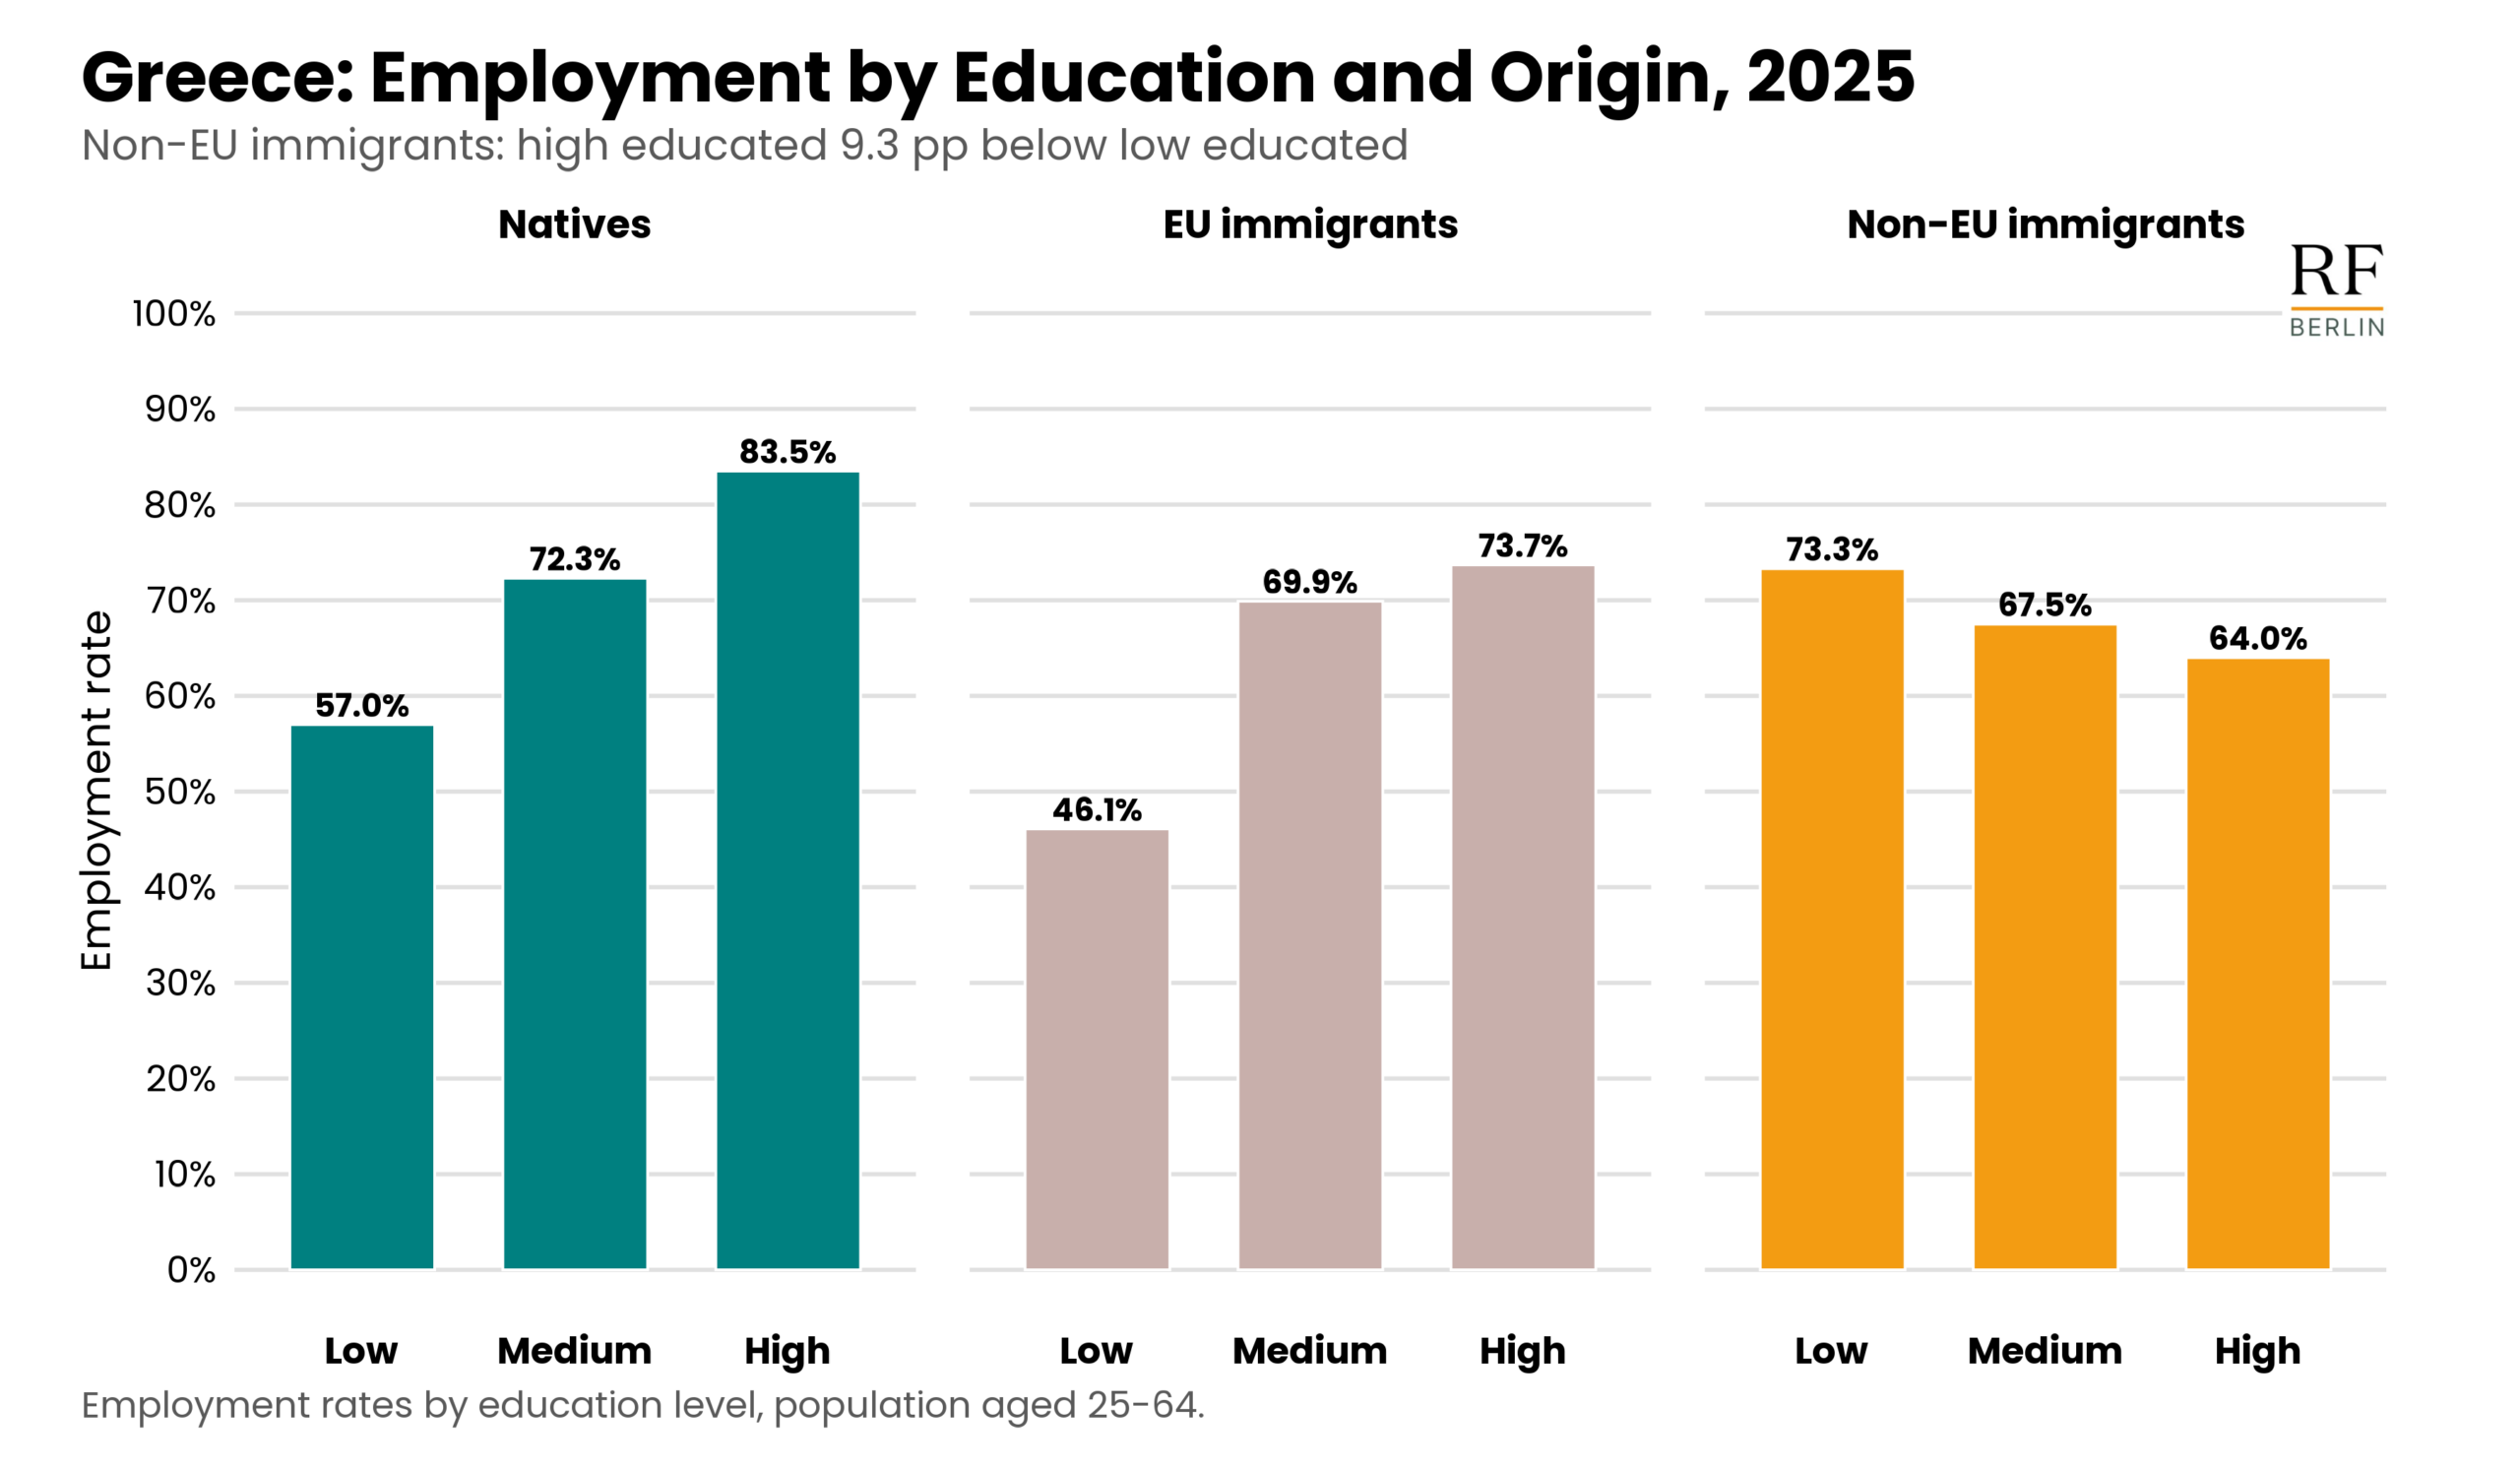
Source: Own computation based on data from Eurostat, LFSA_ERGAEDCOB (downloaded on 6 July 2026). Notes: Employment rates by education and origin group in 2025 in Greece. Employment rates refer to the share of employed individuals aged 25–64 within each education group.
This pattern is consistent with the design of Greece’s labour migration policy, which is primarily oriented towards addressing labour shortages in sectors such as agriculture, construction, tourism and hospitality through annual admission quotas. According to the 2025 admission plan[1], Greece authorised up to 89,290 positions for third-country nationals, of which 41,670 were allocated to dependent employment and 45,620 to seasonal work, while only 2,000 positions were reserved for highly qualified employment under the EU Blue Card and related schemes (European Migration Network, 2025). This institutional framework may contribute to explaining why employment outcomes among non-EU immigrants are strongest at lower levels of education, whereas highly educated migrants continue to face greater difficulties in accessing jobs commensurate with their qualifications.
[1] Government Gazette, Act of the Council of Ministers No. 56/2024, ΦΕΚ A’ 210/30.12.2024, Φ.Ε.Κ. – Εθνικό Τυπογραφείο.
Conclusion
The employment rate among immigrants in the European Union has increased markedly in recent years. By 2025, employment rates among EU-born immigrants exceeded those of natives in many Member States, while non-EU immigrant men had almost reached the employment levels of native-born men. These developments suggest that, for large parts of the immigrant population, access to employment is no longer the principal challenge.
At the same time, labour market integration remains highly uneven. Employment disadvantages are increasingly concentrated among specific groups rather than immigrants as a whole. Non-EU immigrant women continue to experience substantially lower employment rates than both co-national men and other women, while highly educated non-EU immigrants frequently fail to translate their qualifications into employment outcomes comparable to those of similarly educated natives. These findings point to persistent barriers that extend beyond educational attainment and labour market demand.
The figures above highlight substantial untapped employment potential, particularly among female non-EU immigrants. Increasing labour market participation among this group could help ease labour shortages across many EU countries. In addition, improving the recognition and transferability of foreign qualifications, reducing unnecessary licensing and certification barriers, and facilitating better job matching would improve labour market outcomes for immigrants while making more effective use of available skills.
References
Dustmann, C., Frattini, T., Preston, I.P. (2013), “The Effect of Immigration along the Distribution of Wages,” The Review of Economic Studies, Review of Economic Studies Ltd, vol. 80(1), pages 145-173, https://doi.org/10.1093/restud/rds019.
European Migration Network (2025), Asylum and Migration Overview: Greece National Report 2024, European Commission, Brussels. Available at: https://home-affairs.ec.europa.eu/document/download/f559f465-a4b9-4d44-a0c1-2715eb380e1d_en?filename=2024_EMN-EL-AMO.pdf.
Frattini, T. and Dalmonte, M. (2024), Skilled but struggling: The “brain waste” dilemma of migrants in Europe, VoxEU, Centre for Economic Policy Research (CEPR), https://cepr.org/voxeu/columns/skilled-struggling-brain-waste-dilemma-migrants-europe.
OECD (2017), Making Integration Work: Assessment and Recognition of Foreign Qualifications, Making Integration Work, OECD Publishing, Paris, https://doi.org/10.1787/9789264278271-en.
Technical Appendix
Data sources
The analysis relies on the following datasets:
- LFSA_ERGAEDCOB (Employment rates by educational attainment level and country of birth), downloaded on 6 July 2026. This dataset is used as main dataset in the analysis.
- MIGR_POP3CTB (Population on 1 January by age group, sex and country of birth), downloaded on 10 July 2026. This dataset is used to calculate the shares of EU and non-EU immigrants in the total foreign-born working age population.
- LFSA_PGACWS (Population in private households by country of birth and labour status), downloaded on 14 July 2026. This dataset is used to calculate the share of women in each population group within the total working-age population.
- EDAT_LFS_9912 (Population in private households by educational attainment level and country of birth), downloaded on 14 July 2026. This dataset is used to calculate the shares of EU and non-EU immigrants aged 25-64 with low, medium, and high levels of education within their respective population groups.
Unless otherwise stated, the analysis focuses on individuals aged 15–64. Figures that examine employment outcomes by educational attainment are instead based on the population aged 25–64, in order to minimise the inclusion of individuals who are still in education.
As Eurostat periodically revises its data, the figures reported in this publication may differ slightly from those published in earlier or subsequent releases.
Definition of Foreign-Born Population
We define as “immigrants” persons residing in a country other than their country of birth. The analysis distinguishes between EU-born immigrants (individuals born in another EU Member State) and non-EU-born immigrants (individuals born outside the European Union).
Included Countries
The EU average figures reported throughout the analysis refer to the Eurostat EU27 aggregate.
When looking at individual member countries, we focus only on EU countries where the foreign-born population accounts for at least 10% of the total population in 2025. Based on this criterion, the sample comprises 20 countries: Austria, Belgium, Croatia, Cyprus, Czechia, Denmark, Estonia, Finland, France, Germany, Greece, Ireland, Italy, Luxembourg, Malta, the Netherlands, Portugal, Slovenia, Spain, and Sweden, whereas Bulgaria, Hungary, Latvia, Lithuania, Poland, Romania and Slovakia are excluded.
Education Categories
This report groups education into three categories based on the ISCED 2011 classification. Low education refers to ISCED levels 0-2, corresponding to less than primary, primary and lower secondary education. Intermediate education refers to ISCED levels 3-4, corresponding to upper secondary and post-secondary non-tertiary education. High (or tertiary) education refers to ISCED levels 5-8, corresponding to short-cycle tertiary, bachelor’s or equivalent, master’s or equivalent, and doctoral or equivalent education. All education indicators in the report refer to the population aged 25-64. This age range is used to focus on the adult working-age population and to reduce the influence of ongoing education among younger age groups.
Appendix Figures
Figure A.1
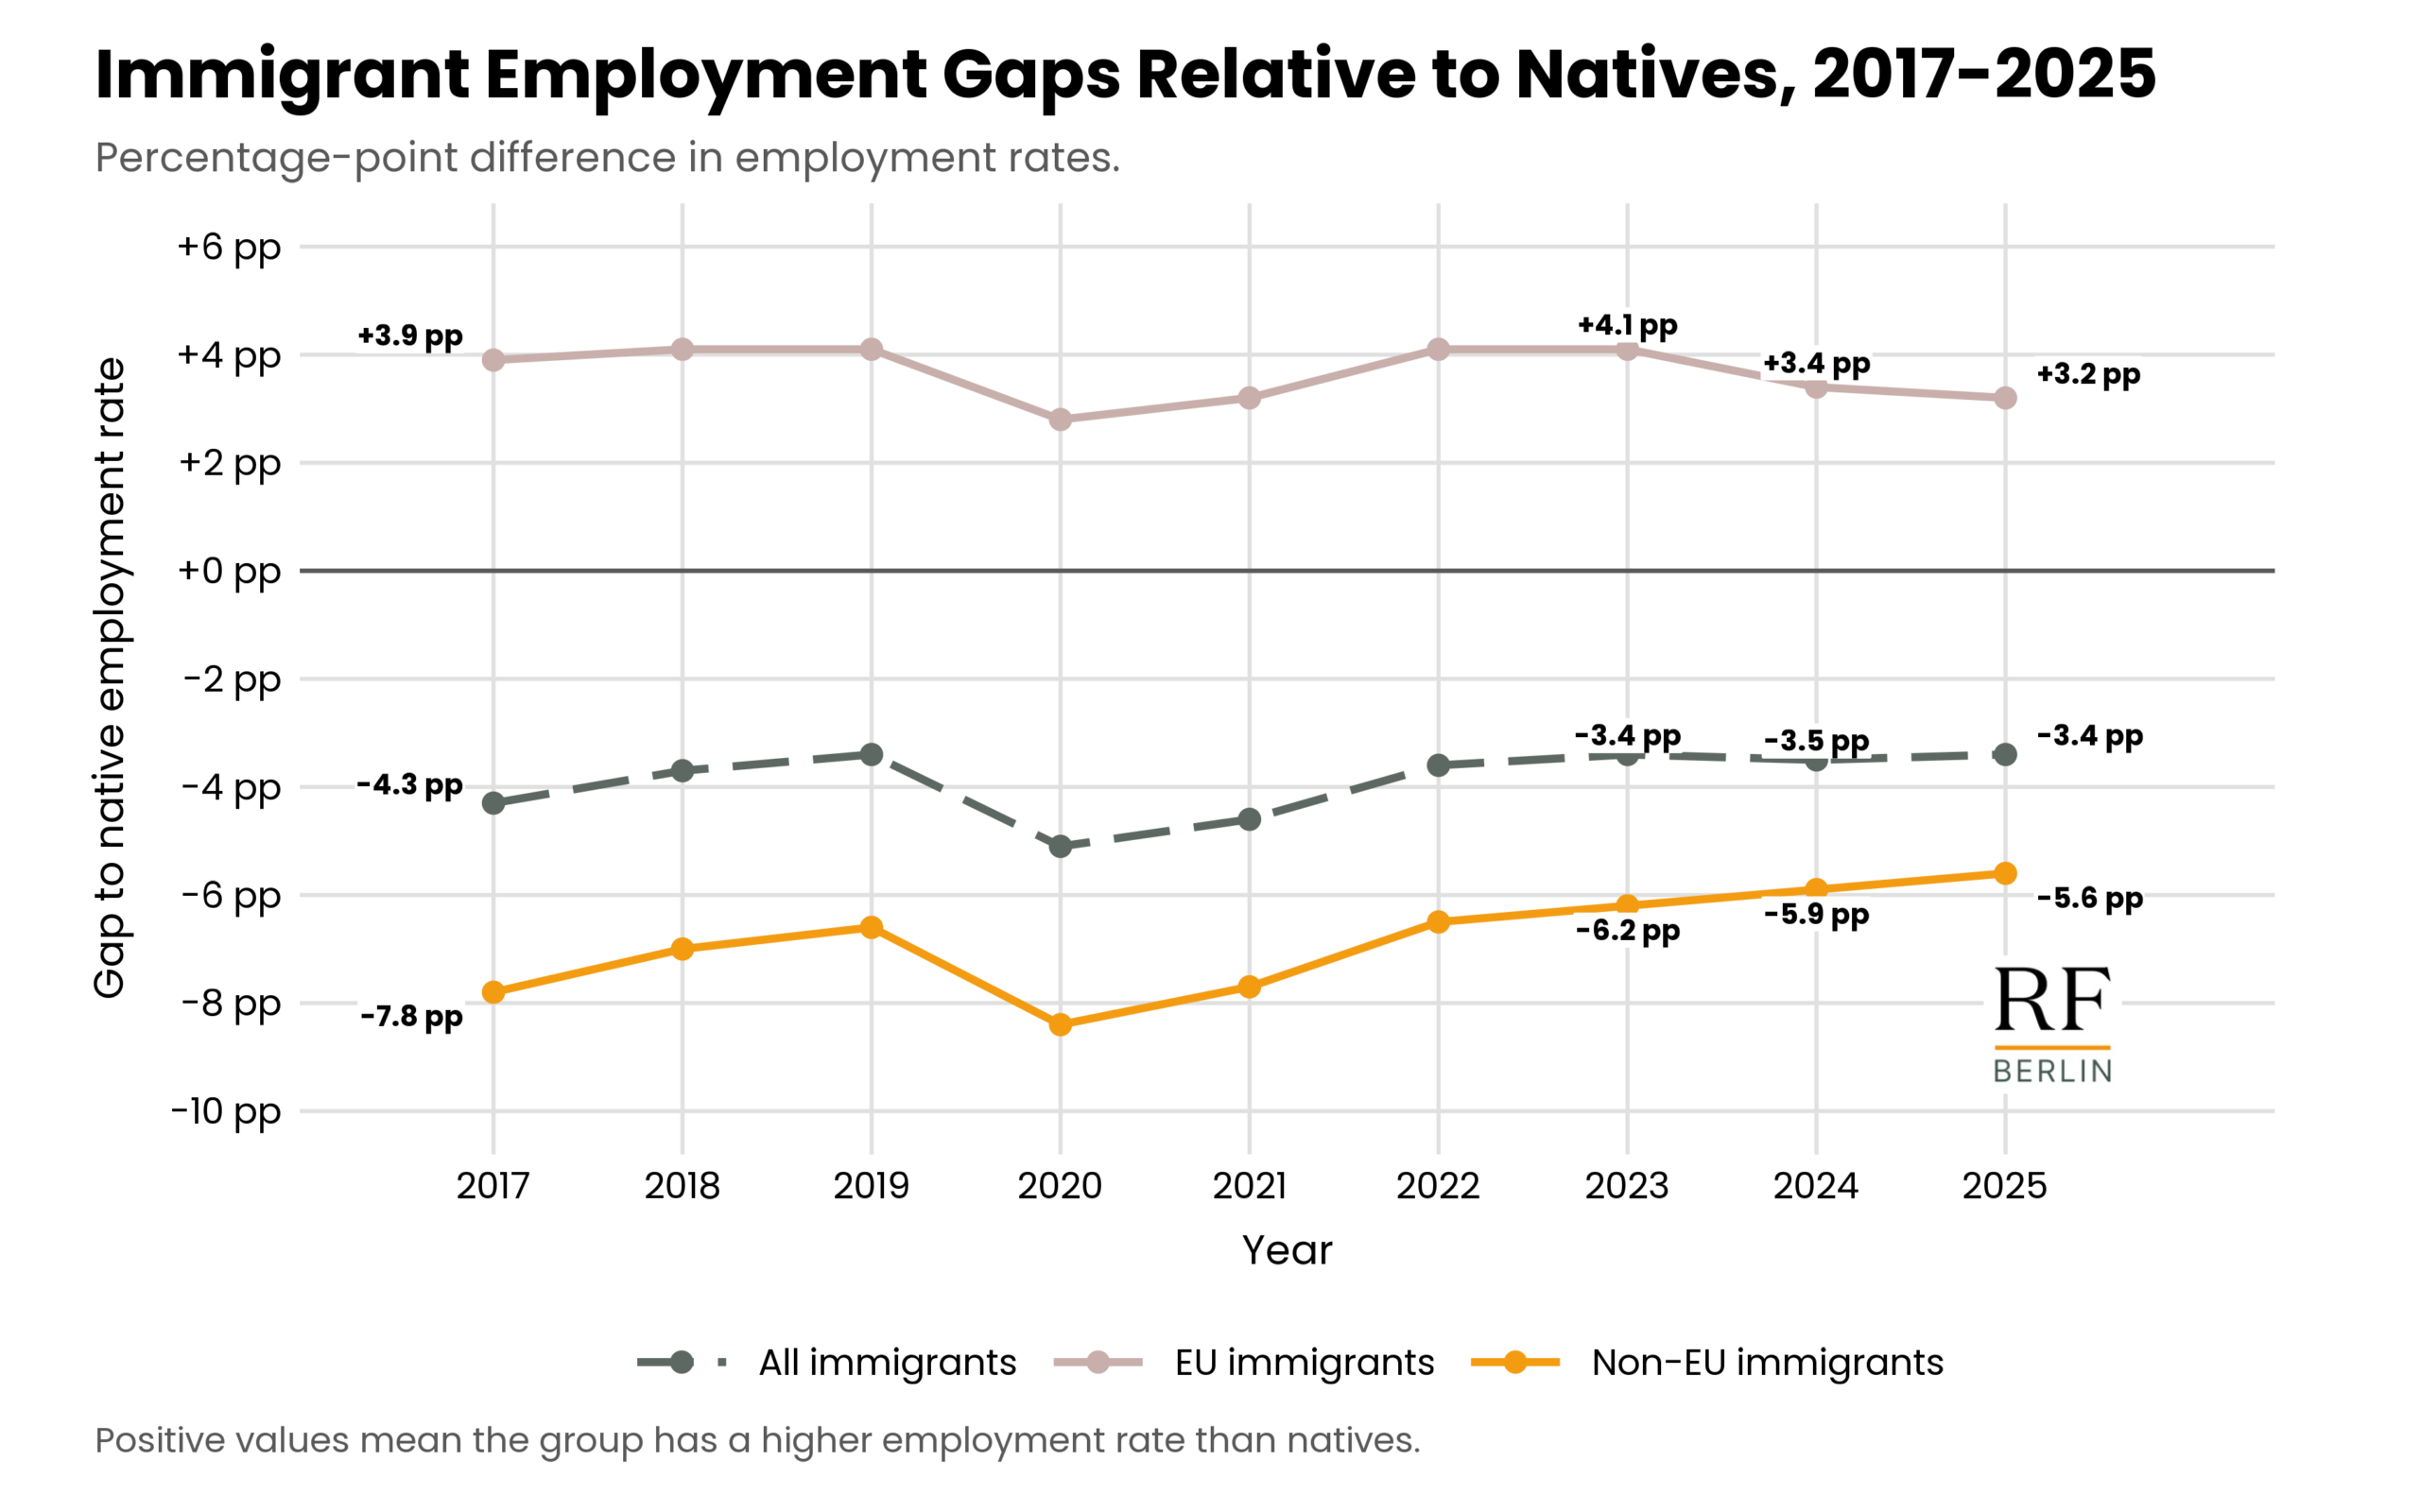
Source: Own computation based on data from Eurostat, LFSA_ERGAEDCOB (downloaded on 6 July 2026). Notes: Gap in employment rates relative to natives by country of birth for the European Union average over time. Employment rates refer to the share of employed individuals in the population aged 15 to 64 for the respective group. Immigrants are defined as individuals born in a country other than their country of residence. EU immigrants are individuals born in another EU Member State, while non-EU immigrants are individuals born outside the EU. The European Union includes all 27 Member States as of February 1st, 2020.
Figure A.2
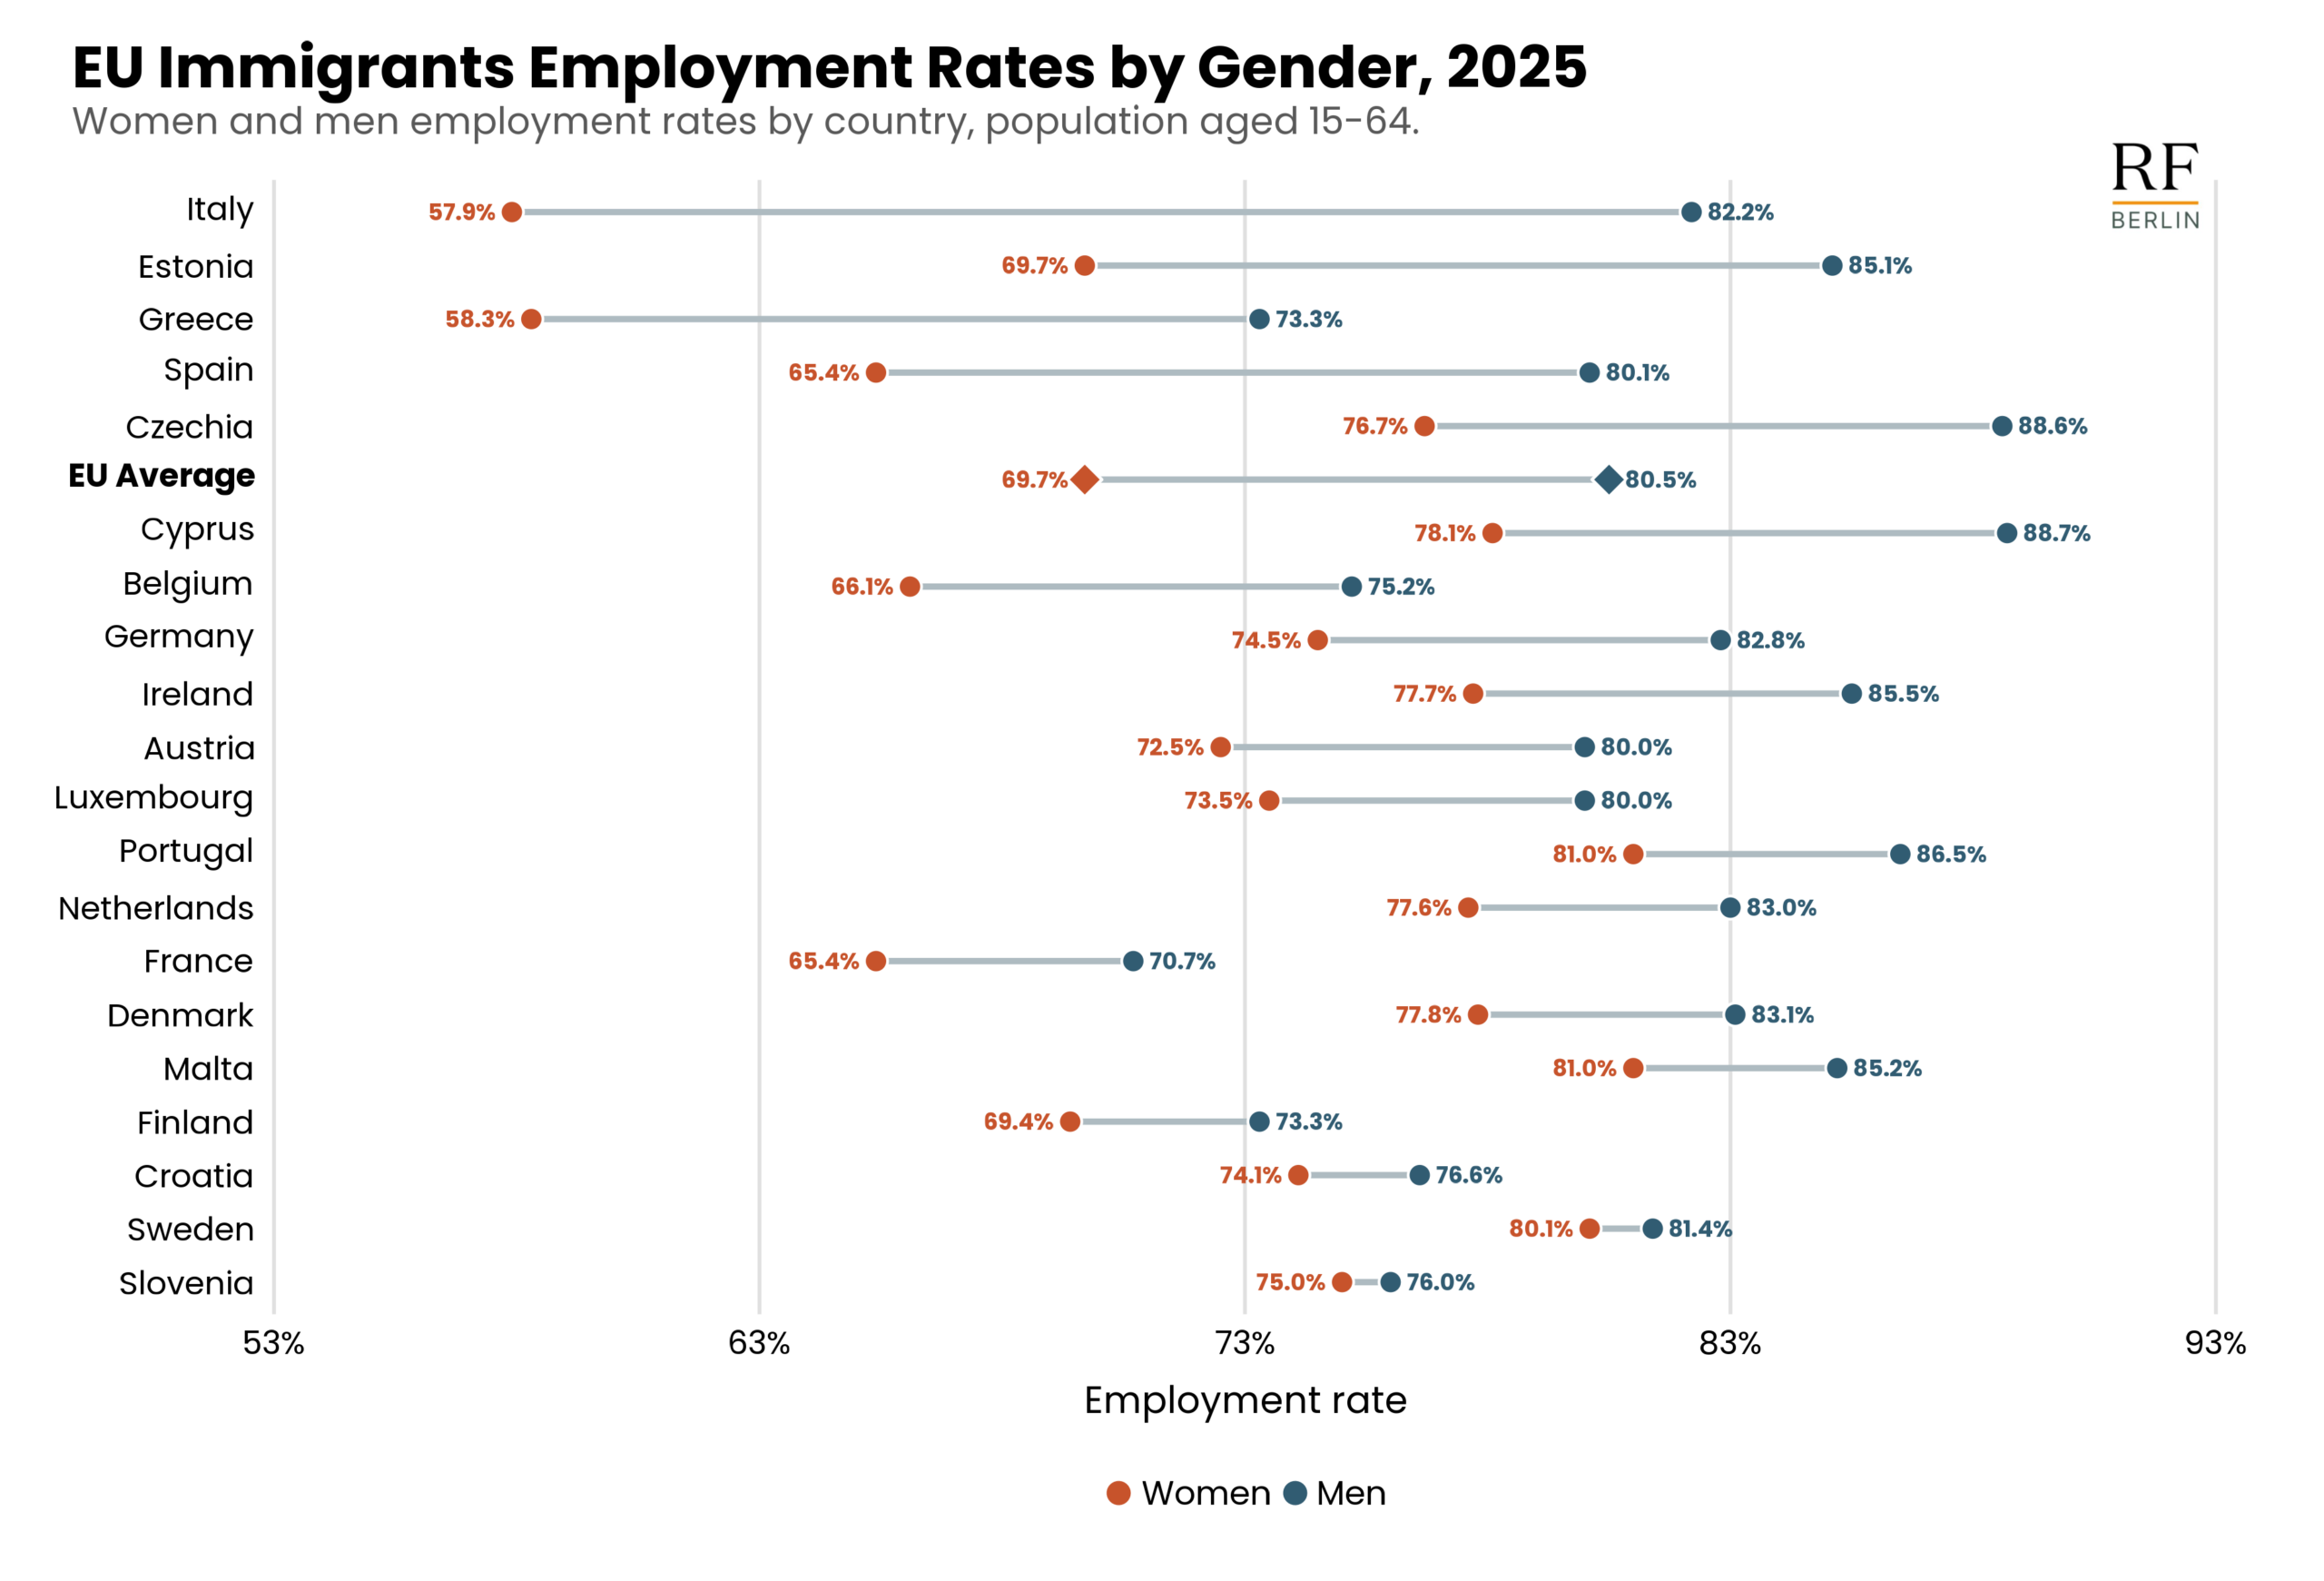
Source: Own computation based on data from Eurostat, LFSA_ERGAEDCOB (downloaded on 6 July 2026). Notes: Employment rates of EU immigrant women and men by country in 2025. Employment rates refer to the share of employed individuals in the population aged 15 to 64 for the respective group. Countries are sorted by the gender gap, measured as men’s employment rate minus women’s employment rate. Point labels show employment rates; diamonds mark the EU average. The country-level analysis includes EU countries where immigrants account for at least 10% of the working-age population in 2025.
Figure A.3
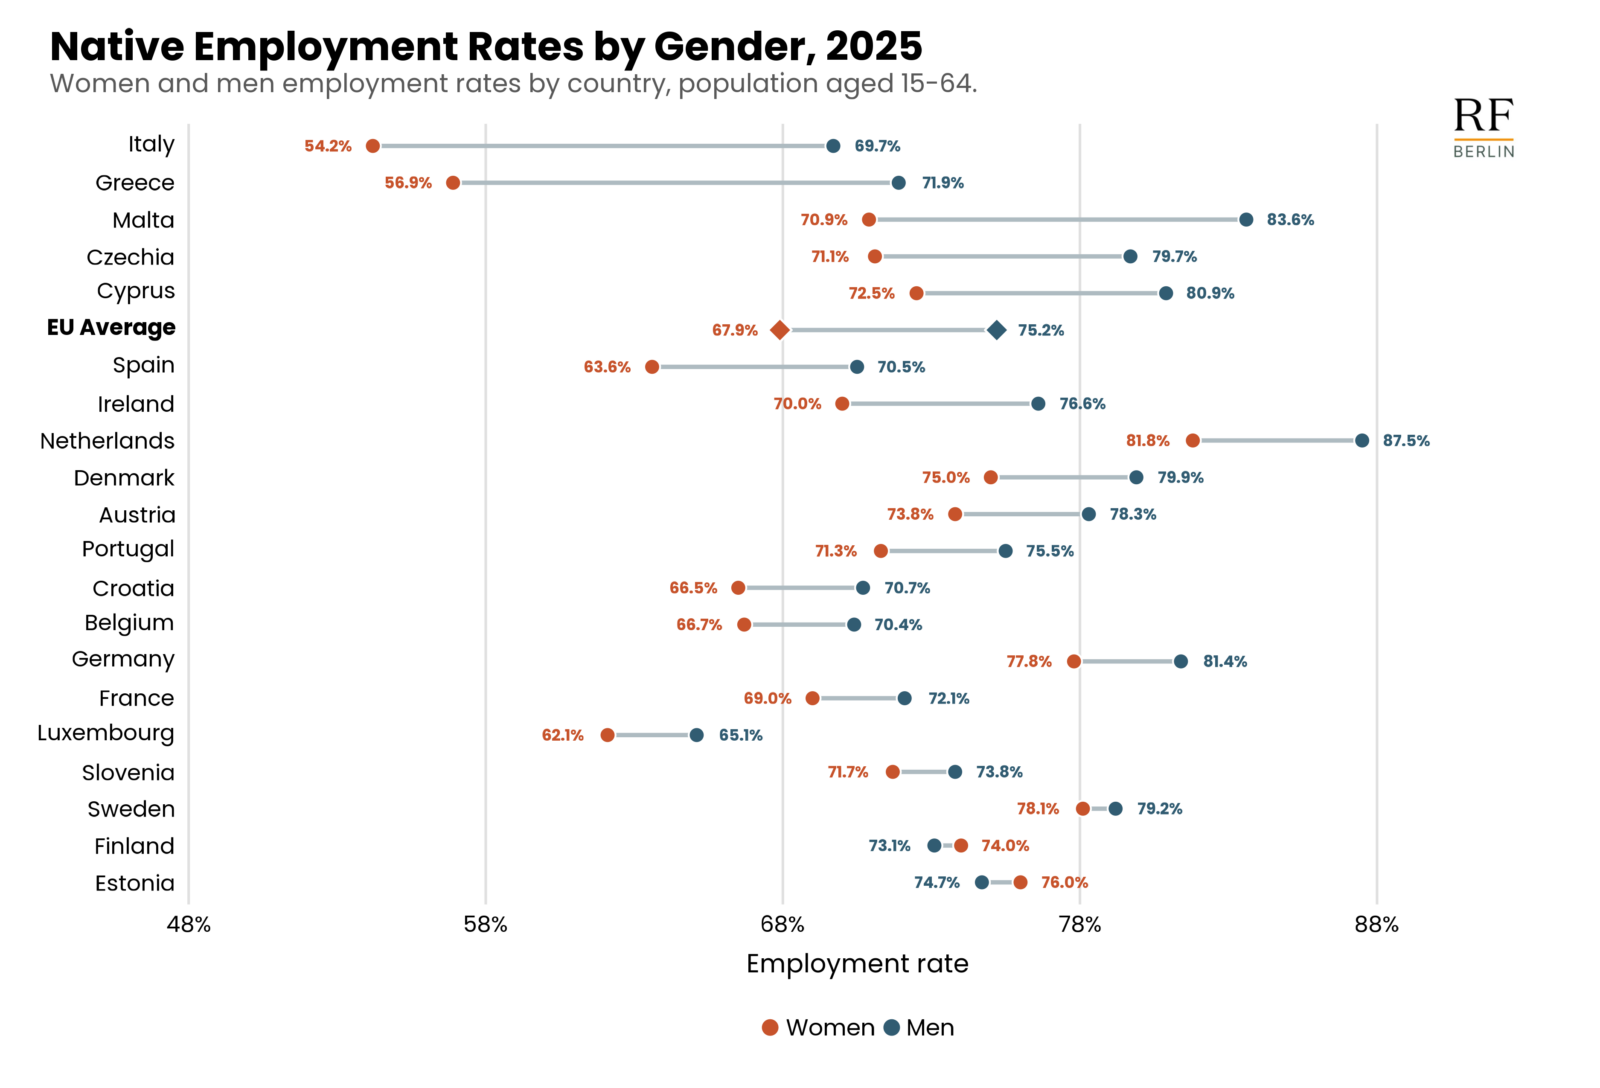
Source: Own computation based on data from Eurostat, LFSA_ERGAEDCOB (downloaded on 6 July 2026). Notes: Employment rates of native women and men by country in 2025. Employment rates refer to the share of employed individuals in the population aged 15 to 64 for the respective group. Countries are sorted by the gender gap, measured as men’s employment rate minus women’s employment rate. Point labels show employment rates; diamonds mark the EU average. The country-level analysis includes EU countries where immigrants account for at least 10% of the working-age population in 2025.
