
Summary
- The employment rate of non-EU immigrants reached its highest level in 2024 at 65.3%, while that of EU migrants remained very close to the previous year, at 74.9%.
- EU immigrants continue to have higher employment rates than both natives (71.4%) and non-EU immigrants. The gap between the two immigrant groups narrowed slightly in 2024, from 10.5 to 9.6 percentage points.
- The employment gap between natives and non-EU migrants is driven by differences in female employment probability. Among men, the gap is minimal: in 2024, the employment rate of non-EU men was 74.3%, just one percentage point below that of native men (75.3%).
- In 2024, the gender gap in employment was largest among non-EU immigrants, at 17.5 percentage points, compared to 11.2 points for EU immigrants. The smallest gender gap was recorded among natives, at 7.9 points.
- Employment rates of EU immigrants exceed those of natives across most countries. In contrast, non-EU immigrants tend to have lower employment rates, which is primarily due to lower employment rates among women.
In 2024, following a record high of 75.1% in 2023, the employment rate of EU immigrants remained virtually unchanged at 74.9%, while the employment rate of natives reached a new all-time high of 71.4%. Non-EU immigrants in the European Union continued to strengthen their position in the labour market, reaching an employment rate of 65.3% in 2024, matching the level attained by the other two groups a decade earlier.
Figure 1 shows that between 2010 and 2024, employment rates in the EU increased across all groups. However, employment among immigrants fluctuated more sharply than among natives. In particular, the Covid-19 pandemic affected the employment of both EU and non EU immigrants more severely than that of native-born individuals. Nevertheless, within two years, immigrant employment rates had rebounded and surpassed pre-pandemic levels.
Throughout the period, EU immigrants consistently recorded higher employment rates than both natives and non EU immigrants. The employment gap between EU and non-EU immigrants widened from 7.4 to 9.6 percentage points between 2010 and 2024, in favour of EU migrants.
Figure 1
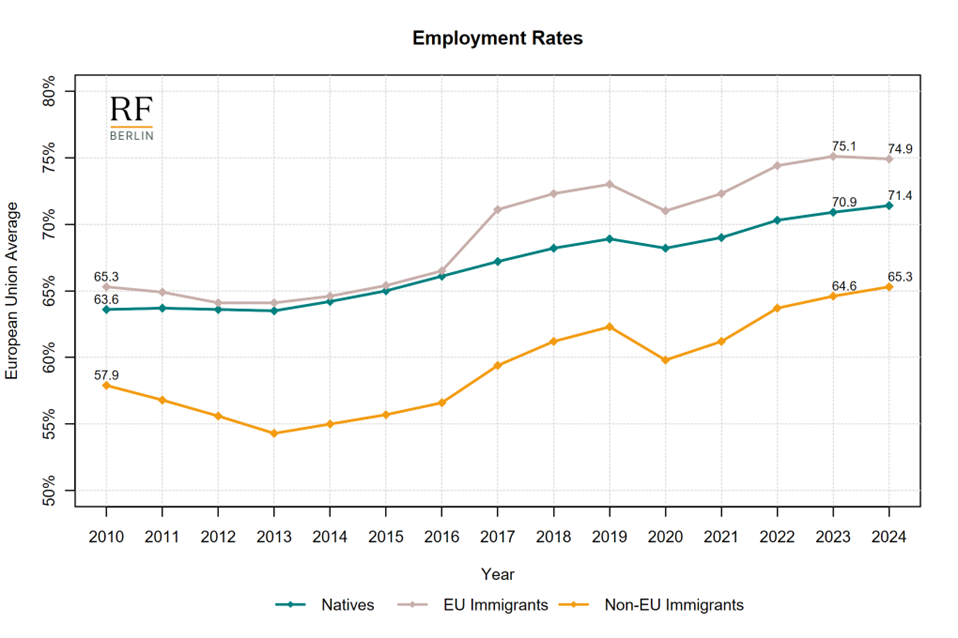
Source: Eurostat, LFSA_ERGAEDCOB (downloaded on 21 April 2025). Notes: the figure reports the employment rate in the European Union for different demographic groups. The employment rate is the share of employed individuals in the population aged 15 to 64 for the respective group. Immigrants are defined as individuals born in a country other than the one in which they reside. The European Union includes all 27 European Member States as of February 1st, 2020.
Immigrant men, both from EU and non-EU countries, consistently exhibited higher employment rates than immigrant women. Although non-EU immigrant women made notable gains, with their employment rate rising from 50.4% in 2010 to 56.8% in 2024, the gender gap among non-EU immigrants remained particularly wide. As shown in Figure 2, the gender employment gap in 2024 was 17.5 percentage points for non-EU immigrants, compared to 11.2 points for EU immigrants. The smallest gap was observed among natives, at 7.9 percentage points.
Figure 2
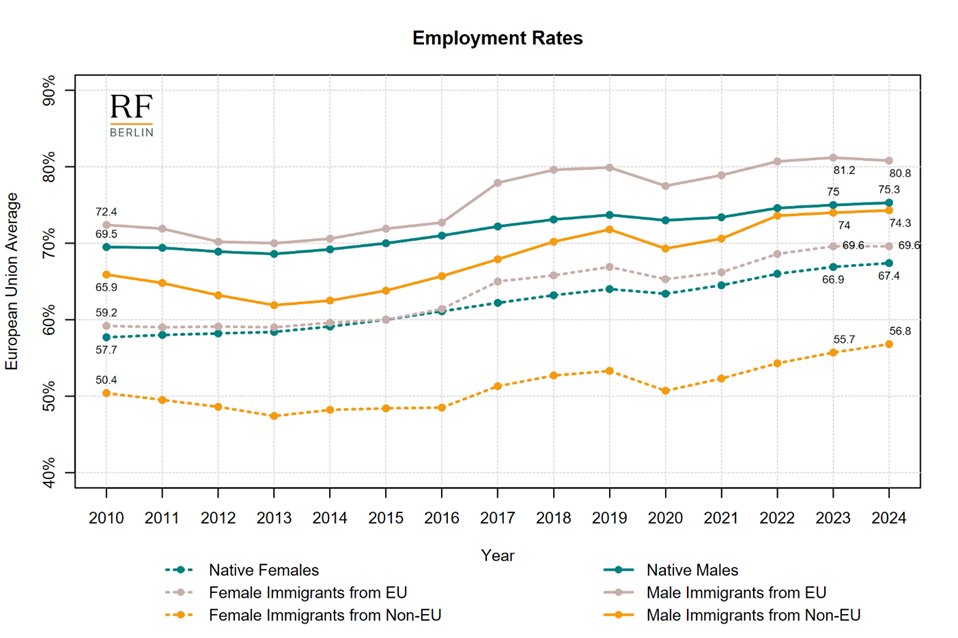
Source: Eurostat, LFSA_ERGAEDCOB (downloaded on 21 April 2025). Notes: the figure reports the average employment rate in the European Union for different demographic groups. The employment rate is the share of employed individuals in the population aged 15 to 64 for the respective group. Immigrants are defined as individuals born in a country other than the one in which they reside. The European Union includes all 27 European Member States as of February 1st, 2020.
Between 2010 and 2024, most EU countries recorded substantial progress in the labour market integration of immigrants. Among countries with a sizable immigrant presence – defined as at least 10% of the population being foreign-born in 2010 – Estonia, Ireland, Latvia, and Spain reported the largest increases in employment rates for EU migrants, each exceeding 10 percentage points. Among other countries, Figure 3 shows that Poland stands out: it recorded the largest gain in EU immigrant employment (+34.8 percentage points) and the second largest for non-EU immigrants (+23.7 points), reflecting broader changes in the composition of its foreign-born population over time. As shown in Figure A.1, most of the employment gains for non-EU immigrants in Poland occurred during the first half of the period, between 2010 and 2017. Greece was the only country where the employment rate of EU immigrants declined, falling by more than 5 percentage points between 2010 and 2024. This only partially offset the sharper drop of nearly 10 percentage points observed between 2010 and 2017.
For non-EU immigrants, in addition to Poland, the largest improvements in employment rates between 2010 and 2024 were recorded in Malta, Ireland, and Denmark (Figures 3 and A.2).
Figure 3
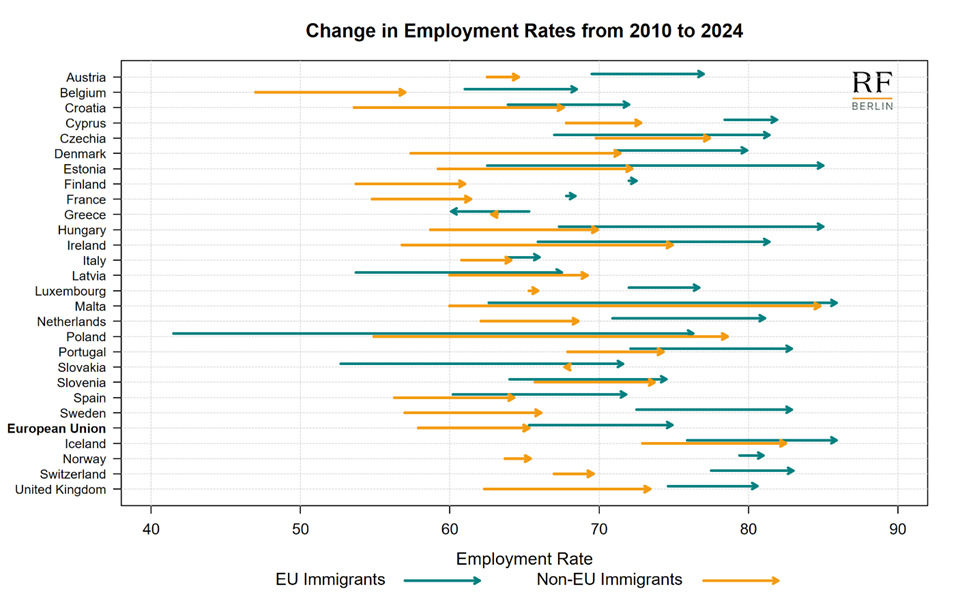
Source: Eurostat, LFSA_ERGAEDCOB (downloaded on 21 April 2025). Notes: the figure reports the change in the employment rate between 2010 and 2024 for EU and non-EU immigrants in each country on the vertical axis. The employment rate is the share of employed individuals in the population aged 15 to 64 for the respective group. Immigrants are defined as individuals born in a country other than the one in which they reside. Bulgaria, Germany, Lithuania and Romania are not reported due to missing data. The European Union includes all 27 European Member States as of February 1st, 2020.
A comparison of employment rates between natives and immigrants across countries reveals a positive correlation (Figure 4): countries with higher native employment rates also tend to report higher employment probabilities for immigrants. Consistent with the patterns shown in Figure 1, Figure 4 further indicates that EU immigrants generally have higher employment rates than natives, while non-EU immigrants typically exhibit lower rates. The largest positive employment gaps for EU immigrants relative to natives are found in Malta, Hungary, and Estonia (Figure 4, left panel). In contrast, the most pronounced negative gaps for non-EU immigrants are observed in the Netherlands, Switzerland, Norway, Sweden, and Belgium (Figure 4, right panel).
Disaggregating the data by gender confirms these trends: the higher employment rates of EU immigrants relative to natives are observed for both men and women (left panels of Figures A.3 and A.4 in the Appendix). By contrast, the lower labour market integration of non EU immigrants is primarily driven by women (right panels). Notably, in several countries— such as Poland, Czechia, and Italy—non-EU male immigrants have higher employment rates than native-born men (Figure A.3, right panel).
Figure 4
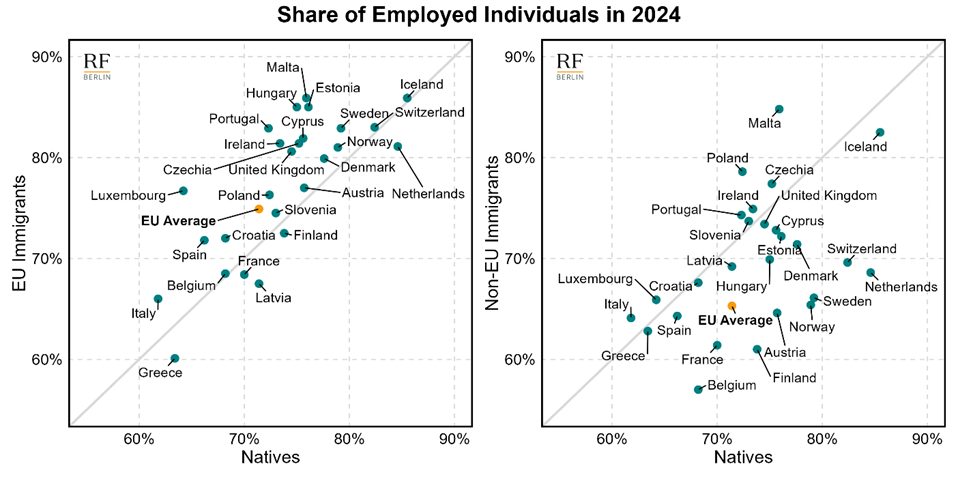
Source: Eurostat, LFSA_ERGAEDCOB. Notes: the figure reports the employment rates of EU and non-EU immigrants versus natives in each country in 2024. The employment rate is the share of employed individuals in the population aged 15 to 64 for the respective group. Immigrants are defined as individuals born in a country other than the one in which they reside. The European Union includes all 27 European Member States as of February 1st, 2020.
Methodological Notes and Data
The analysis is based on data provided by Eurostat, dataset LFSA_ERGAEDCOB (Employment rates by sex, age, educational attainment level and country of birth), downloaded on 21 April 2025.
Eurostat estimates of the employment rate in LFSA_ERGAEDCOB are based on data from the EU-LFS survey. The EU-LFS is a quarterly household sample survey that collects information on the labor market participation of individuals aged 15 and over. The scope is limited to persons living in private households; it excludes those in institutional or collective households (such as dormitories, hospitals, or military barracks), as well as individuals performing military or community service. Therefore, asylum seekers hosted in collective housing are not included in the target population of the EU-LFS survey. Asylum seekers represent approximately 2.6% of total non-EU migrants across EU countries in 2024.
Appendix
Figure A.1
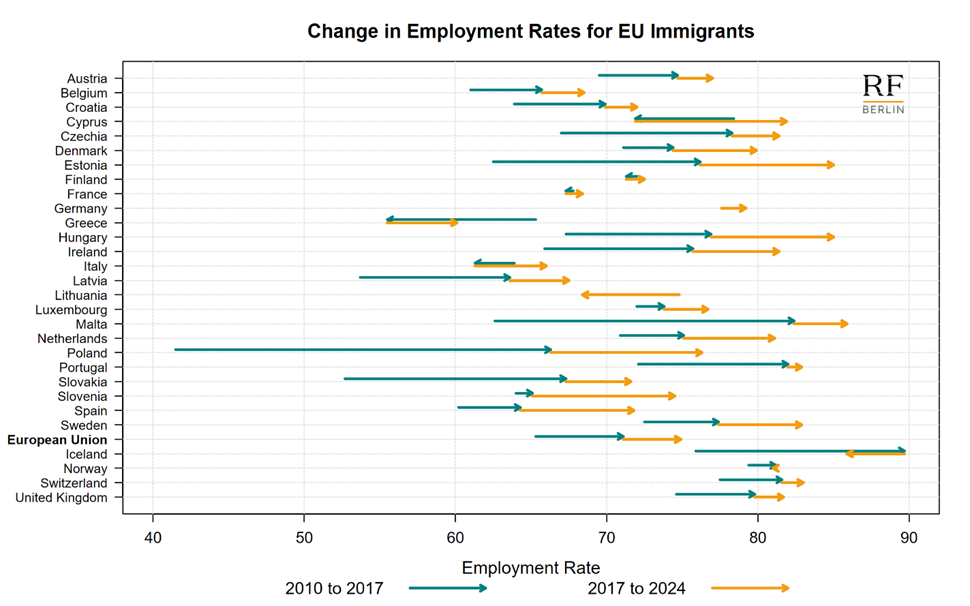
Source: Eurostat, LFSA_ERGAEDCOB (downloaded on 21 April 2025). Notes: the figure reports the change in the employment rate between 2010 and 2017, and between 2017 and 2024 for EU immigrants in each country on the vertical axis. The employment rate is the share of employed individuals in the population aged 15 to 64 for the respective group. Immigrants are defined as individuals born in a country other than the one in which they reside. Bulgaria and Romania are not reported due to missing data. The European Union includes all 27 European Member States as of February 1st, 2020.
Figure A.2
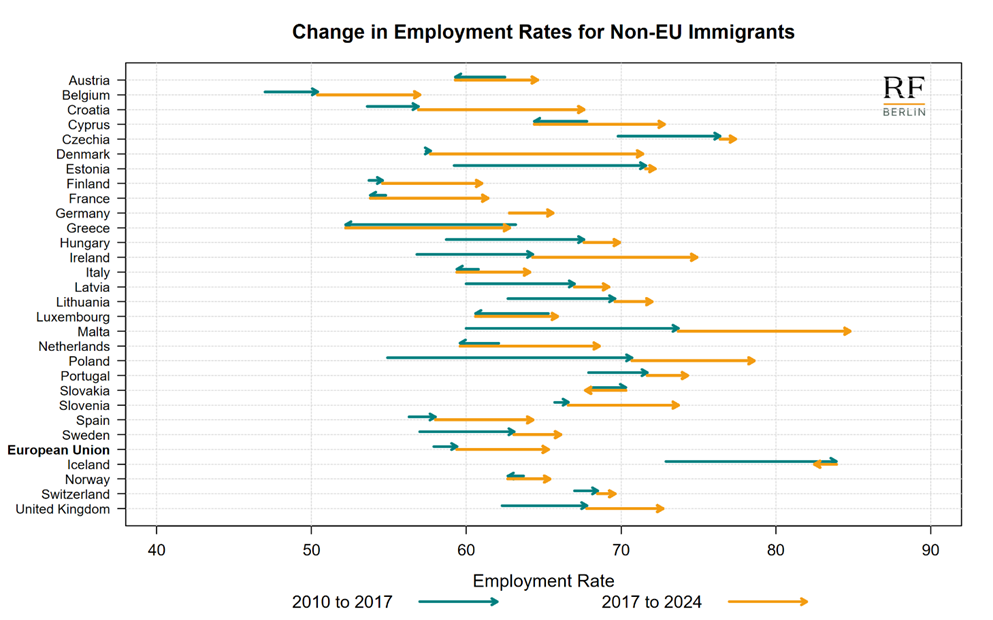
Source: Eurostat, LFSA_ERGAEDCOB (downloaded on 21 April 2025). Notes: the figure reports the change in the employment rate between 2010 and 2017, and between 2017 and 2024 for non-EU immigrants in each country on the vertical axis. The employment rate is the share of employed individuals in the population aged 15 to 64 for the respective group. Immigrants are defined as individuals born in a country other than the one in which they reside. Bulgaria and Romania are not reported due to missing data. The European Union includes all 27 European Member States as of February 1st, 2020.
Figure A.3
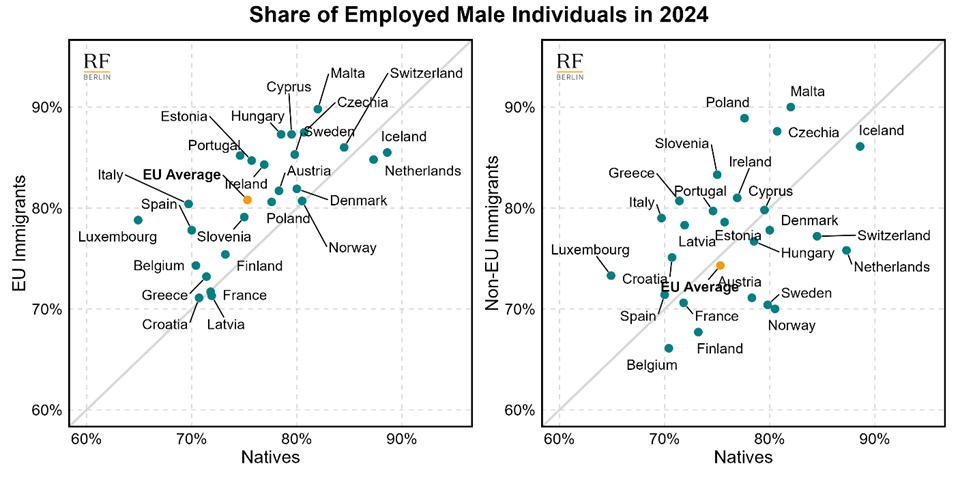
Source: Eurostat, LFSA_ERGAEDCOB (downloaded on 21 April 2025). Notes: the figure reports the employment rates of EU and non-EU immigrants versus natives in each country in 2024. The employment rate is the share of employed individuals in the population aged 15 to 64 for the respective group. Immigrants are defined as individuals born in a country other than the one in which they reside. The European Union includes all 27 European Member States as of February 1st, 2020.
Figure A.4
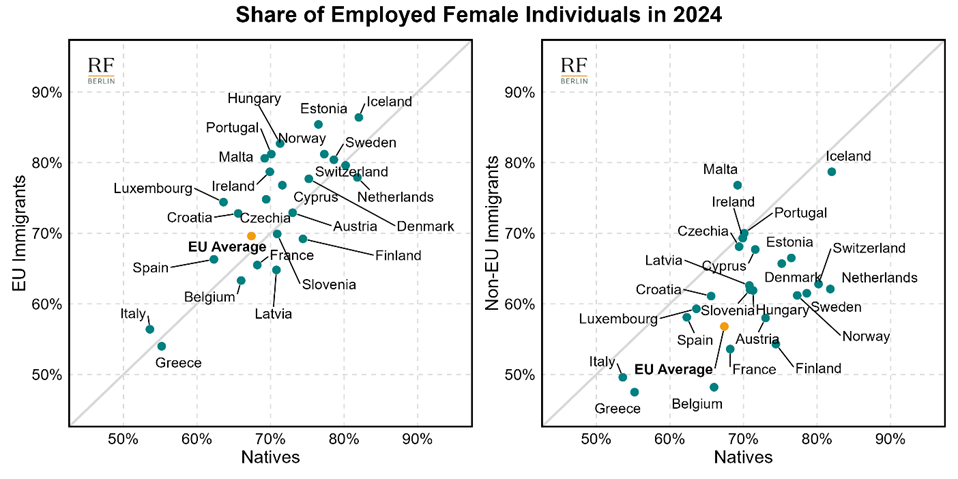
Source: Eurostat, LFSA_ERGAEDCOB (downloaded on 21 April 2025). Notes: the figure reports the employment rates of EU and non-EU immigrants versus natives in each country in 2024. The employment rate is the share of employed individuals in the population aged 15 to 64 for the respective group. Immigrants are defined as individuals born in a country other than the one in which they reside. The European Union includes all 27 European Member States as of February 1st, 2020.