
Summary
- Tertiary attainment has increased steadily across all origin groups since 2017. Among adults aged 25-64, the share with tertiary education rose from 30.3% to 37.7% among natives, from 29.4% to 36.0% among EU-born immigrants, and from 26.0% to 32.6% among non-EU-born immigrants.
- Differences are sharper when looking at the full education distribution. Non-EU-born immigrants have by far the largest low-educated share, at 35%, compared with 24% among EU-born immigrants and 16% among natives.
- Immigrant-native gaps differ strongly across countries. Immigrants as a whole have higher tertiary attainment than natives in Ireland, Luxembourg, Denmark, Estonia, Latvia, Malta, Portugal, and Czechia, while they have lower attainment in the remaining EU countries.
- Aggregate immigrant averages can hide different patterns. EU-born immigrants have higher tertiary attainment than natives in several countries, with the largest positive gaps in Malta, Luxembourg, and Denmark. Among non-EU-born immigrants, positive gaps are less frequent. However, Ireland stands out: non-EU-born immigrants have a tertiary attainment rate 15.6 percentage points higher than natives, while EU-born immigrants have the same tertiary attainment rate as natives.
- Women have higher tertiary attainment than men across all major origin groups, but within-sex comparisons show that immigrant-native gaps are generally most negative for non-EU-born immigrant women, highlighting the importance of considering origin, gender, and country context jointly.
The Big Picture: Tertiary Education in the EU Today
Tertiary educational attainment has increased steadily across all major population groups in the EU since 2017. While natives and EU-born immigrants have followed broadly similar trajectories, non-EU-born immigrants continue to display lower average levels of tertiary education despite substantial progress over time.
Tertiary education rates have increased steadily over time across all EU27 countries for natives, EU and non-EU immigrants, as we show in Figure 1. Among natives (green line), the share of adults aged 25–64 with tertiary education increased from 30.3% in 2017 to 37.7% in 2025. A similarly strong increase was observed among EU-born immigrants (beige line), whose tertiary attainment rose from 29.4% to 36.0%. Among non-EU-born immigrants (orange line), the share grew from 26.0% to 32.6%, resulting in an increase from 27.1% to 33.4% for immigrants overall (grey dashed line).
The upward trend also continued between 2024 and 2025. Among immigrants overall, tertiary attainment rose from 32.8% to 33.4%. This increase reflects gains among both EU-born immigrants, whose tertiary education rate rose from 35.1% to 36.0%, and non-EU-born immigrants, whose share increased from 31.9% to 32.6%. Over the same period, tertiary attainment among natives increased from 36.7% to 37.7%.
By 2025, EU-born immigrants remained much closer to natives in average tertiary attainment than non-EU-born immigrants. Tertiary attainment stood at 37.7% among natives, compared with 36.0% among EU-born immigrants, 33.4% among immigrants overall, and 32.6% among non-EU-born immigrants.
Immigrants in this analysis are defined as foreign-born individuals, regardless of their reason for migration (see Technical Appendix for details).
Figure 1
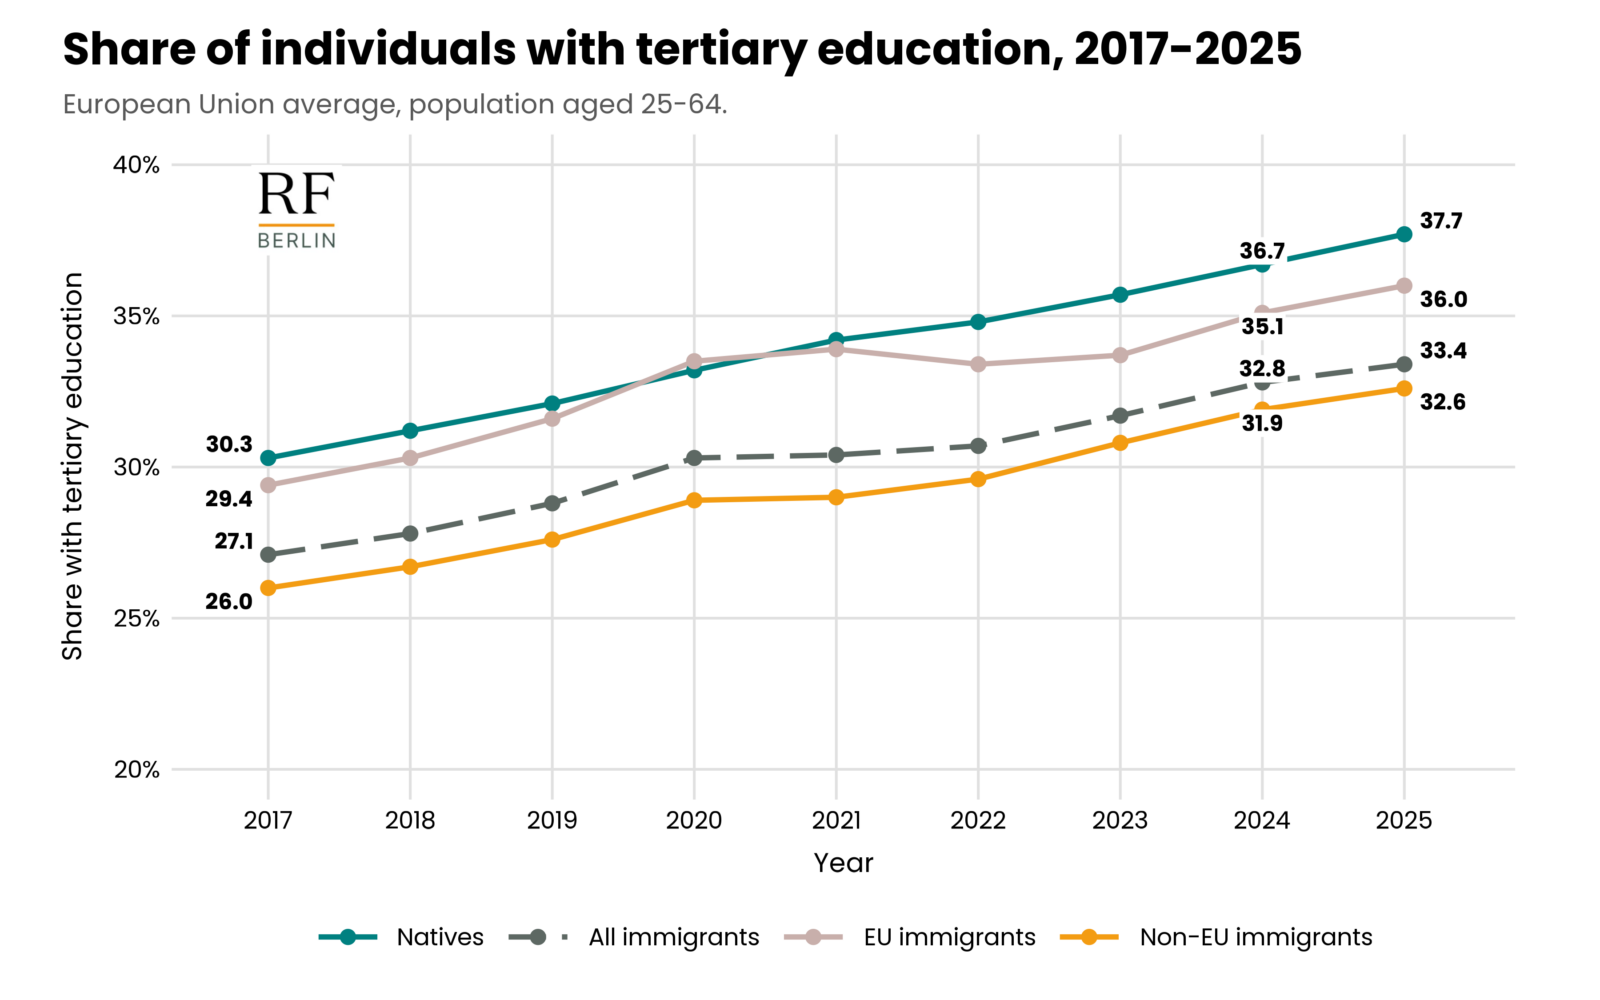
Source: Own computation based on data from Eurostat, lfsa_ergaedcob (downloaded on 22nd April 2026). Notes: Lines show tertiary education shares by origin group from 2017 to 2025.
Educational Structure: More Than Tertiary Attainment
Educational differences between natives and immigrants are not limited to tertiary attainment alone. While EU-born immigrants display an educational profile relatively close to that of natives, non-EU-born immigrants are more strongly represented at both the lower and tertiary ends of the educational distribution. Across all origin groups, women consistently show higher tertiary attainment than men. At the same time, educational outcomes among immigrants vary substantially more across EU countries than those of natives, pointing to a much more heterogeneous educational profile across migrant populations.
Looking only at tertiary attainment captures only part of the broader educational differences between groups. Figure 2 presents the full distribution of natives and immigrants across low, intermediate, and high education, which we define as primary and lower secondary education, upper secondary and post-secondary non-tertiary education, and tertiary education, respectively (see Technical Appendix for details).
Natives and EU-born immigrants display relatively similar educational structures, with larger shares concentrated in intermediate and tertiary education and comparatively smaller shares in low education. Still, among natives, only 16% fall into the low education category, compared with 24% among EU-born immigrants.
By contrast, non-EU-born immigrants show a more evenly distributed educational profile across the three education levels. Although their share of tertiary educated individuals is only slightly lower than that of natives and EU-born immigrants, their share with low education is substantially higher, reaching 35%.
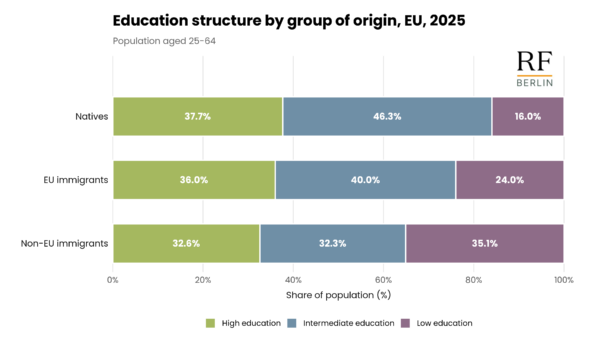
Source: Own computation based on data from Eurostat, lfsa_ergaedcob (downloaded on 22nd April 2026).
Across all three origin groups, women display higher tertiary attainment than men at the EU level. Among natives, 41.1% of women aged 25–64 hold tertiary qualifications, compared with 34.2% of men. Among EU-born immigrants, the corresponding figures are 37.9% for women and 33.7% for men, while among non-EU-born immigrants they are 34.8% and 30.3%, respectively.
Figure 3 adds a gender perspective to these patterns. Across all three origin groups, women display higher tertiary attainment than men at the EU level. Among natives, 41.1% of women aged 25–64 hold tertiary qualifications, compared with 34.2% of men. Among EU-born immigrants, the corresponding figures are 37.9% for women and 33.7% for men, while among non-EU-born immigrants they are 34.8% and 30.3%, respectively.
Figure 3
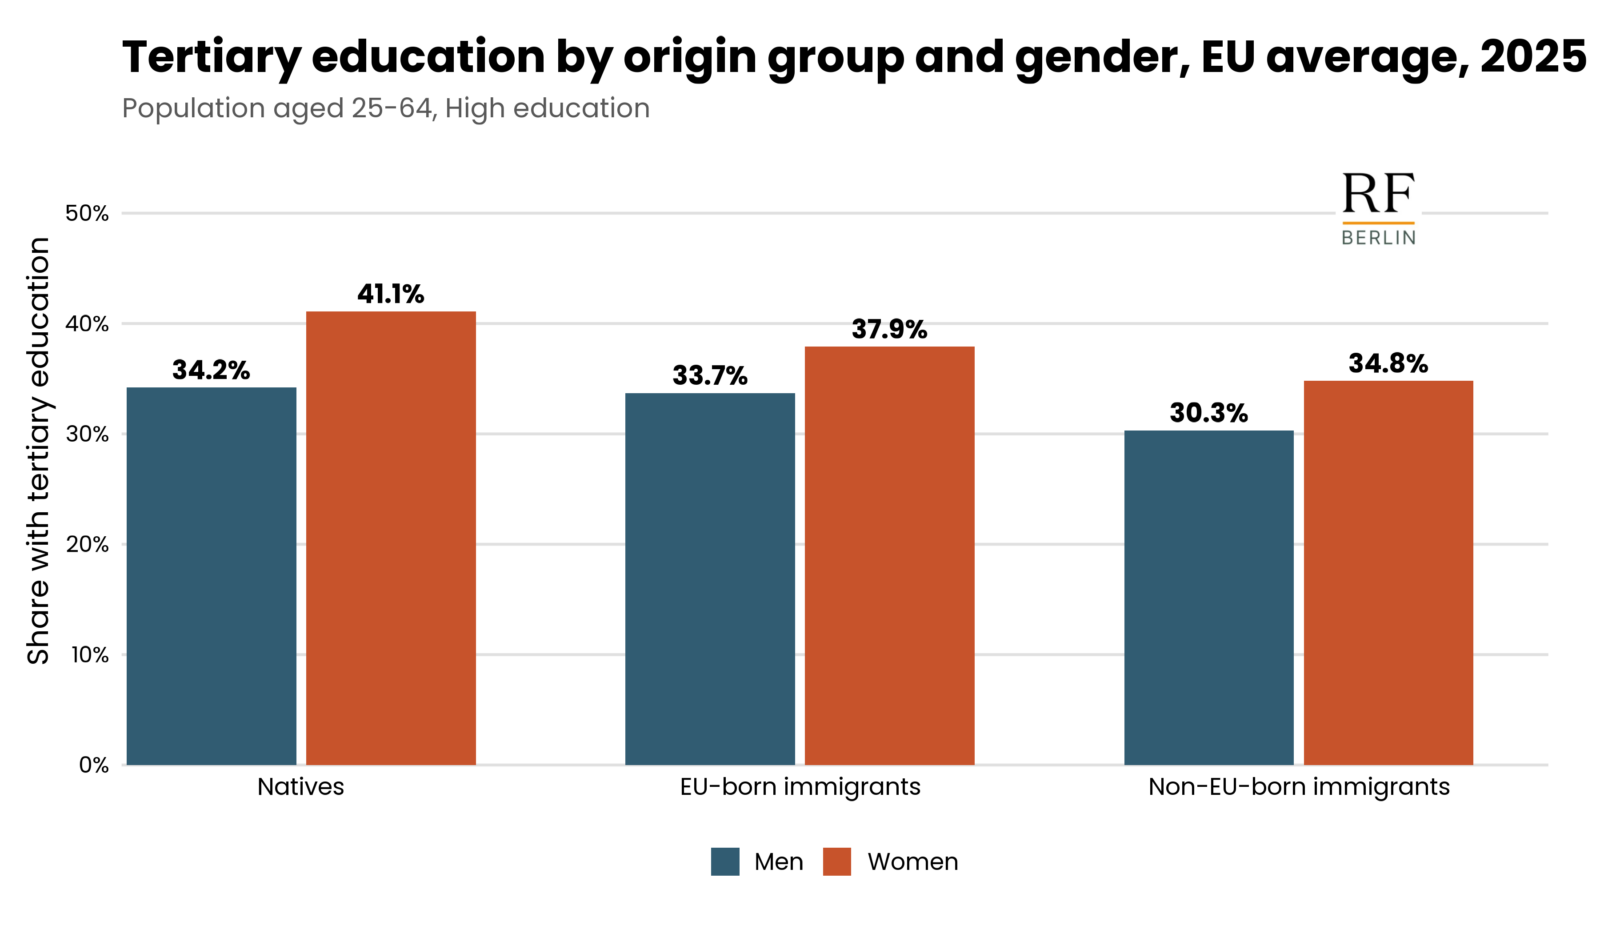
Source: Own computation based on data from Eurostat, lfsa_ergaedcob (downloaded on 22nd April 2026). Notes: Bars are ordered by origin group: natives, EU-born immigrants, and non-EU-born immigrants; within each origin group, men and women are shown separately.
Although average tertiary attainment levels are relatively similar across origin groups at the EU level, Figure 4 shows that cross-country dispersion is substantially larger among immigrants than among natives. We measure cross-country educational dispersion through the coefficient of variation, a statistical index that takes higher values the more dispersed tertiary education is for a population group (see Technical Appendix for details). Among men, the coefficient of variation is 24% for natives, 36% for EU-born immigrants, and 45% for non-EU-born immigrants. In other words, cross-country heterogeneity among non-EU-born immigrant men is roughly twice as large as among native men.
A similar pattern emerges among women, although with generally lower educational dispersion across all population groups. The measure of dispersion stands at 21% among native women, compared with 30% among EU-born immigrant women and 37% among non-EU-born immigrant women.
Figure 4
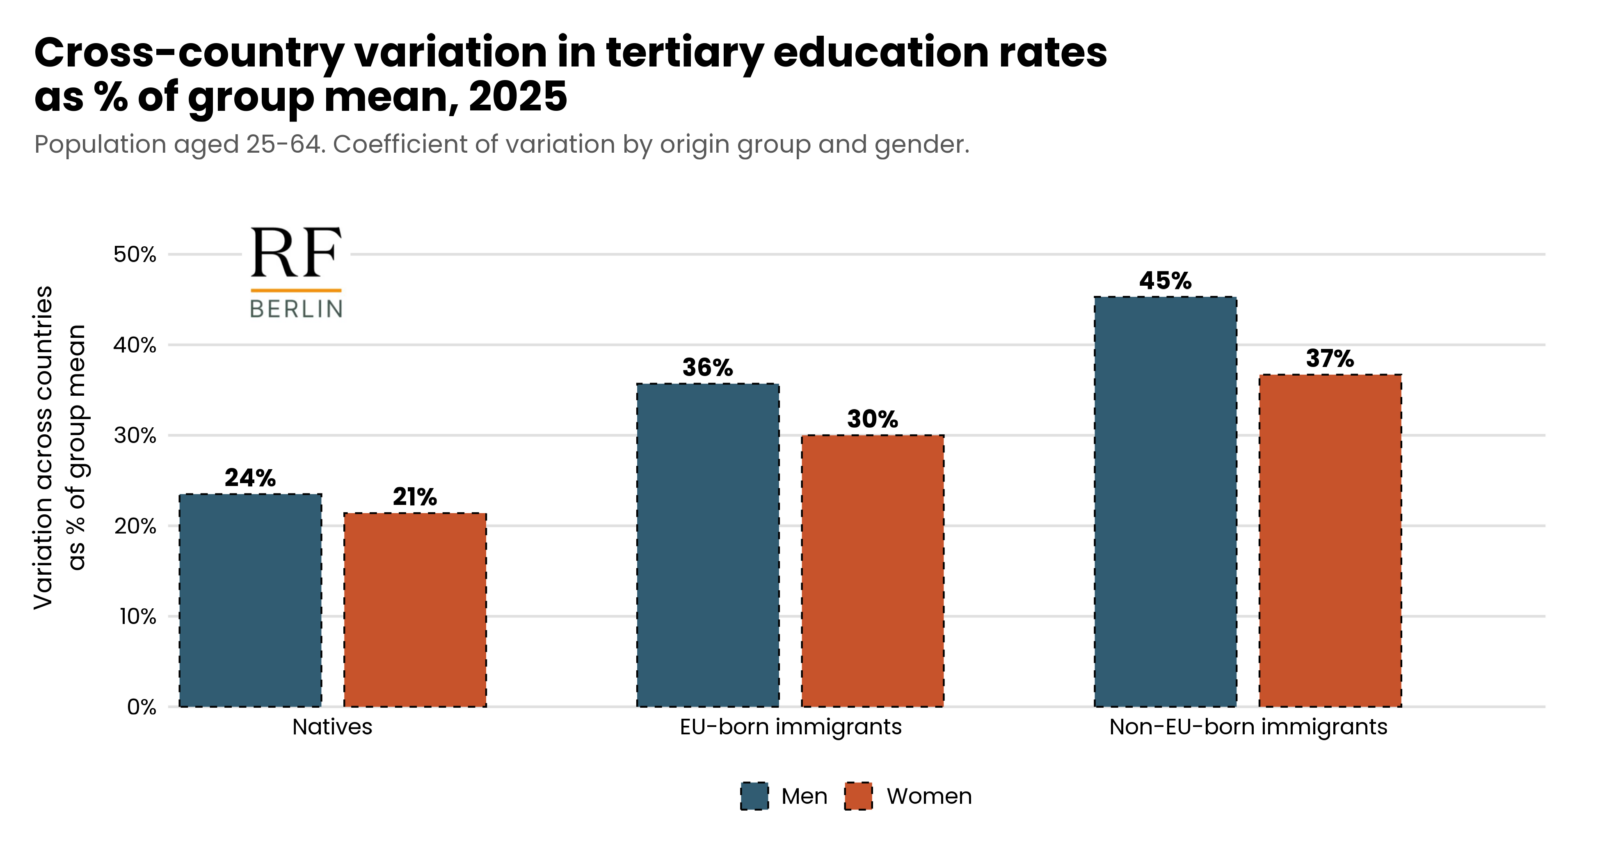
Source: Own computation based on Eurostat, lfsa_ergaedcob (downloaded on 22nd April 2026). Notes: Bars report the coefficient of variation, calculated as the cross-country standard deviation divided by the cross-country mean.
Natives and Immigrants Across Countries
Countries with high tertiary attainment among natives also tend to display high tertiary attainment among immigrants. Yet, behind this broad relationship there are substantial cross-country differences in the educational gap between natives and immigrant populations. Distinguishing between EU-born and non-EU-born immigrants further reveals that aggregate immigrant averages can mask very different origin-specific patterns.
Figure 5 compares tertiary education rates among natives and immigrants across countries. Each point represents a country, with tertiary attainment among natives shown on the horizontal axis and attainment among immigrants on the vertical axis. Countries located above the diagonal are those where immigrants have a higher share of tertiary educated individuals than natives, while countries below the diagonal display the opposite pattern.
Figure 5
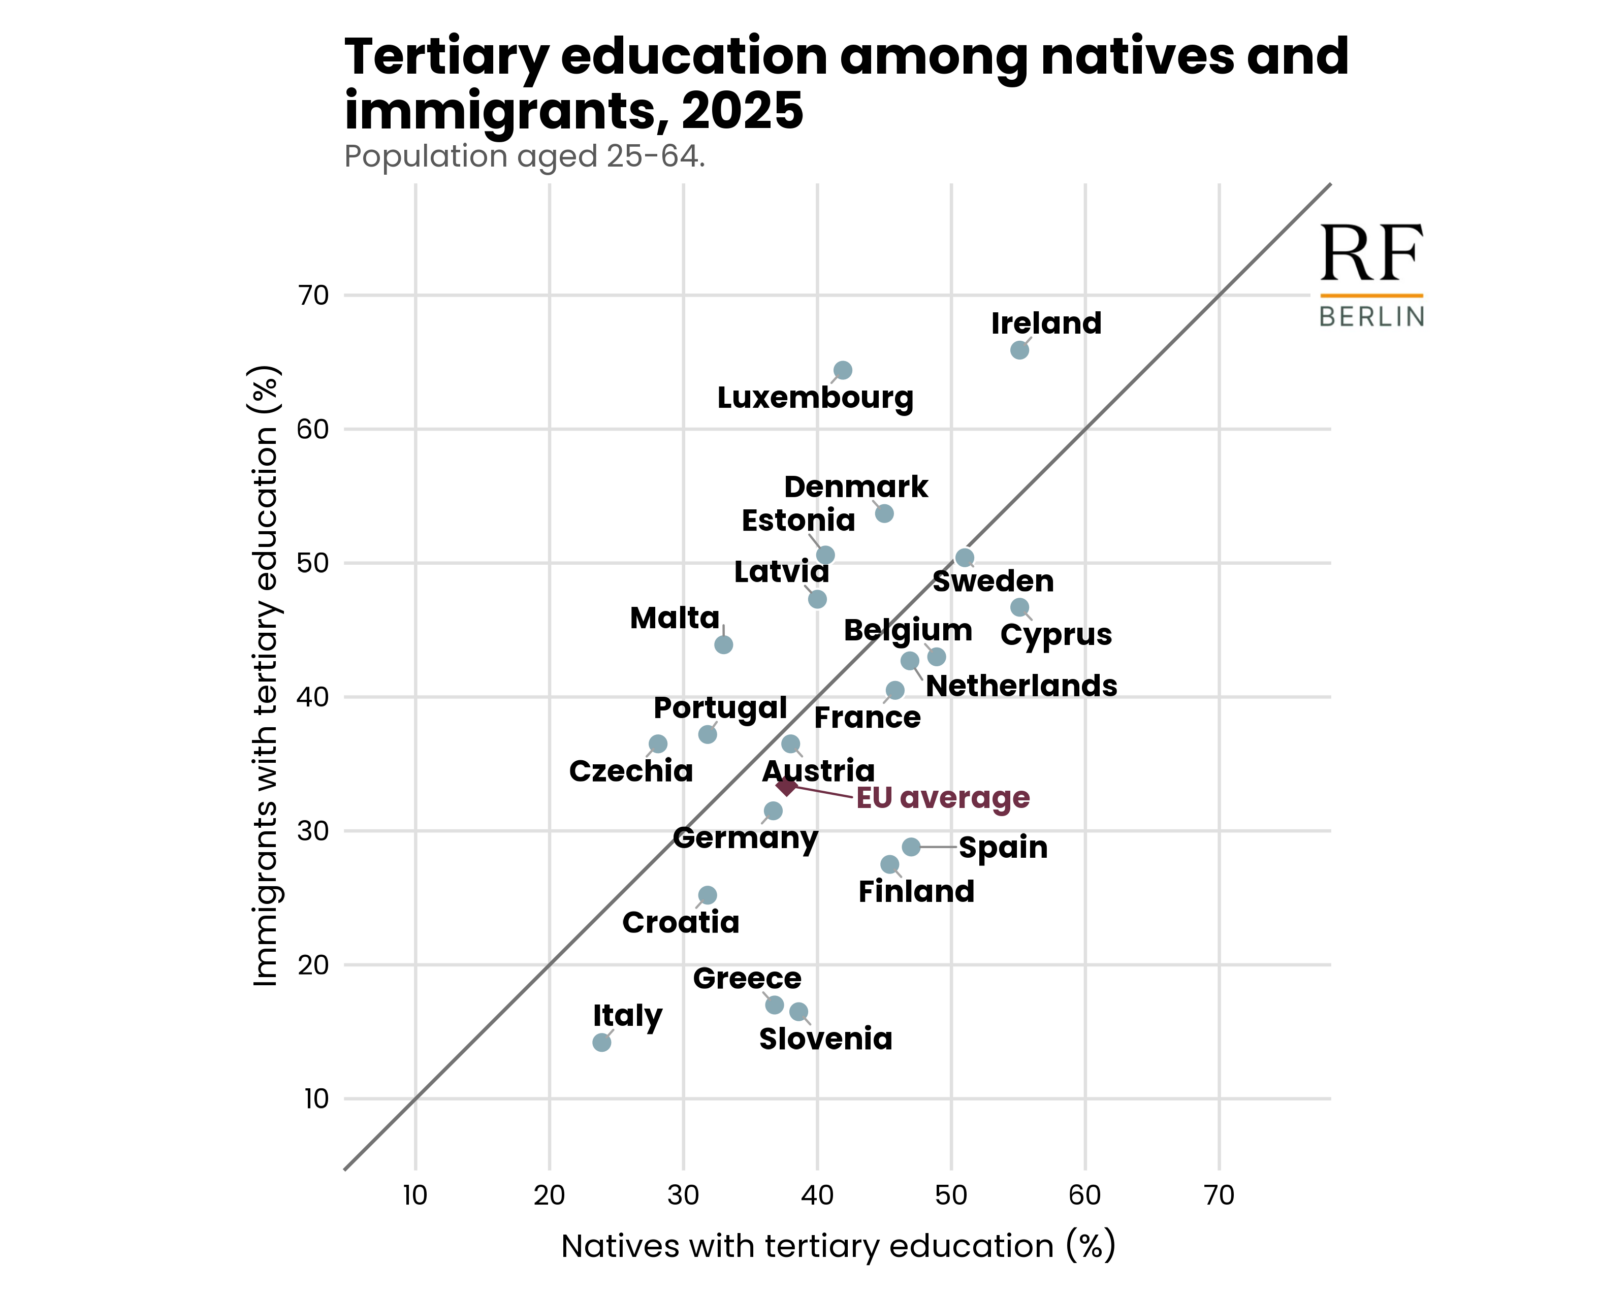
Source: Own computation based on data from Eurostat, lfsa_ergaedcob (downloaded on 22nd April 2026). Notes: Countries are included if the foreign-born population accounts for at least 10% of the total population. The EU average is the Eurostat EU27 aggregate and includes all EU27 countries. Each point is a country; countries are positioned by native tertiary attainment on the horizontal axis and immigrant tertiary attainment on the vertical axis.
Overall, the figure suggests a positive country-level relationship: countries where natives have higher tertiary attainment also tend to have higher tertiary attainment among immigrants. At the same time, countries differ substantially in whether immigrants are above or below the native benchmark.
Several countries lie above the diagonal, including Ireland, Luxembourg, Denmark, Estonia, Latvia, Malta, Portugal and Czechia. In these countries, immigrants as a whole display higher tertiary attainment than natives. In the remaining countries, immigrants have lower tertiary attainment than natives, although the magnitude of the gap varies considerably.
This first comparison treats immigrants as a single, non-differentiated, group. Figures 6 and 7 display – for each EU country and for the EU as a whole – the difference between the share of immigrants and natives with tertiary education, separately for EU-born and non-EU-born immigrants, showing that aggregate immigrant averages can hide important differences by origin (Appendix Table A.1 displays tertiary education shares by country for natives, EU-born and non-EU born immigrants).
Among EU-born immigrants, the average gap relative to natives is relatively small, at -1.7 percentage points (Figure 6). In several countries, EU-born immigrants have higher tertiary attainment than natives, including Malta, Luxembourg, Denmark, Estonia, Czechia, Sweden, Portugal, Austria, the Netherlands, Latvia, Belgium, and, to a lower extent, Croatia.
The largest positive gaps are observed in Malta (+24.1 percentage points relative to natives), Luxembourg (+21.9 percentage points), and Denmark (+20.1 percentage points). Ireland is the only country where EU-born immigrants have exactly the same tertiary attainment rate as natives, implying a zero gap between the two groups.
At the opposite end of the distribution, the largest negative gaps among EU-born immigrants are observed in Finland, Spain, and Greece. The gap reaches -16.2 percentage points in Finland, -13.5 percentage points in Spain, and -10.2 percentage points in Greece. Italy and Cyprus also display sizeable negative differences, at -9.4 and -9.2 percentage points, respectively.
Figure 6
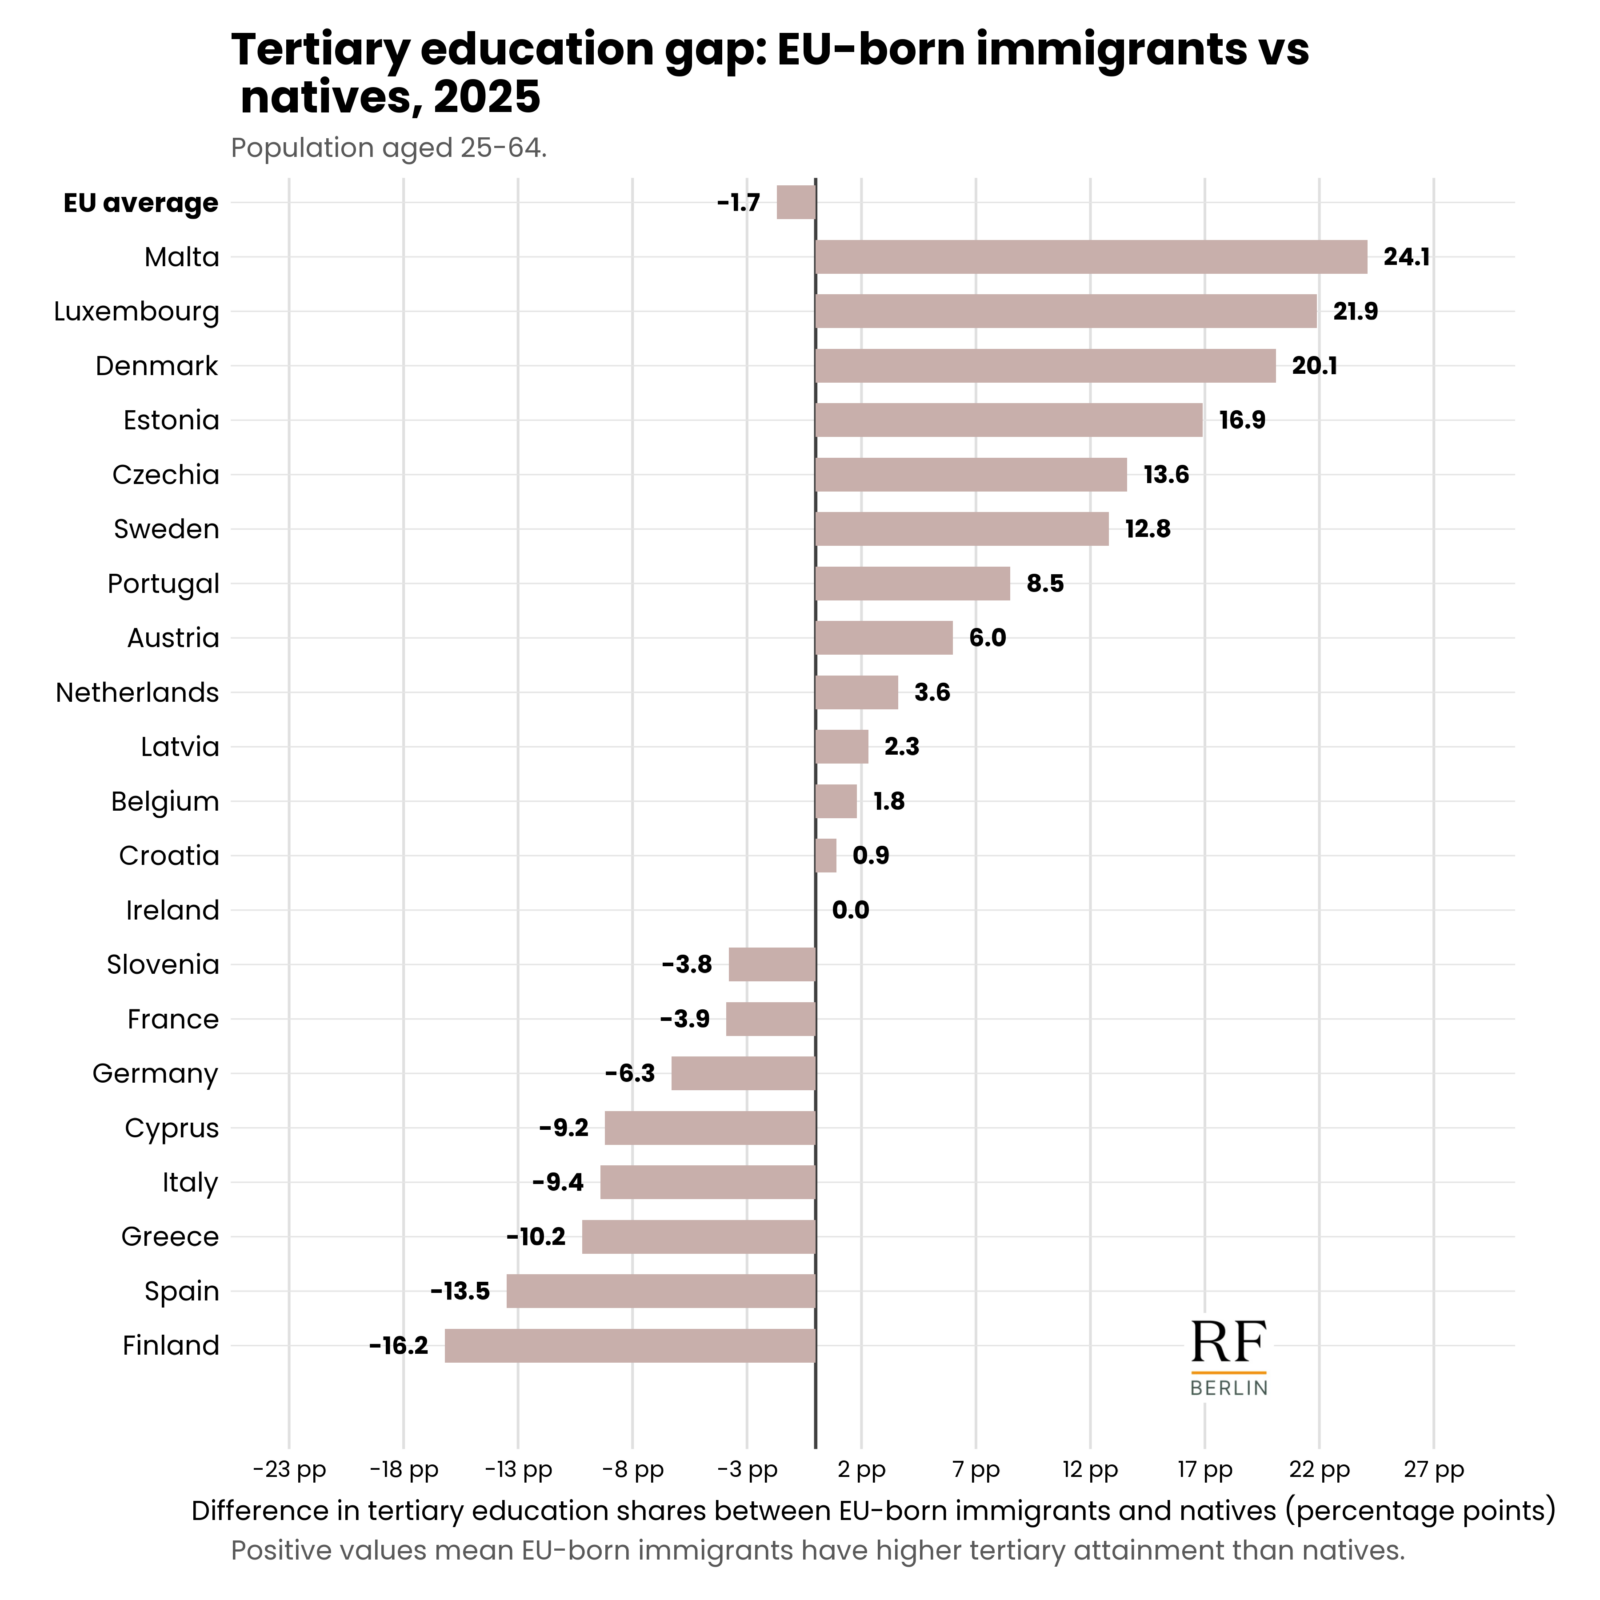
Source: Own computation based on data from Eurostat, lfsa_ergaedcob (downloaded on 22nd April 2026). Notes: Countries are included if the foreign-born population accounts for at least 10% of the total population. The EU average is the Eurostat EU27 aggregate and includes all EU27 countries. Countries are ordered by the gap between EU-born immigrants and natives, from the most positive to the most negative gap.
Among non-EU-born immigrants, the average gap relative to natives is more negative, at -5.1 percentage points (Figure 7). Positive gaps are observed in Luxembourg, Ireland, Estonia, Latvia, Malta, Czechia, Portugal and Denmark. The largest positive gaps are found in Luxembourg (+23.8 percentage points relative to natives), Ireland (+15.6 percentage points), and Estonia (+9.2 percentage points). Latvia (+7.8) and Malta (+7.5) also display sizeable positive gaps.
Figure 7
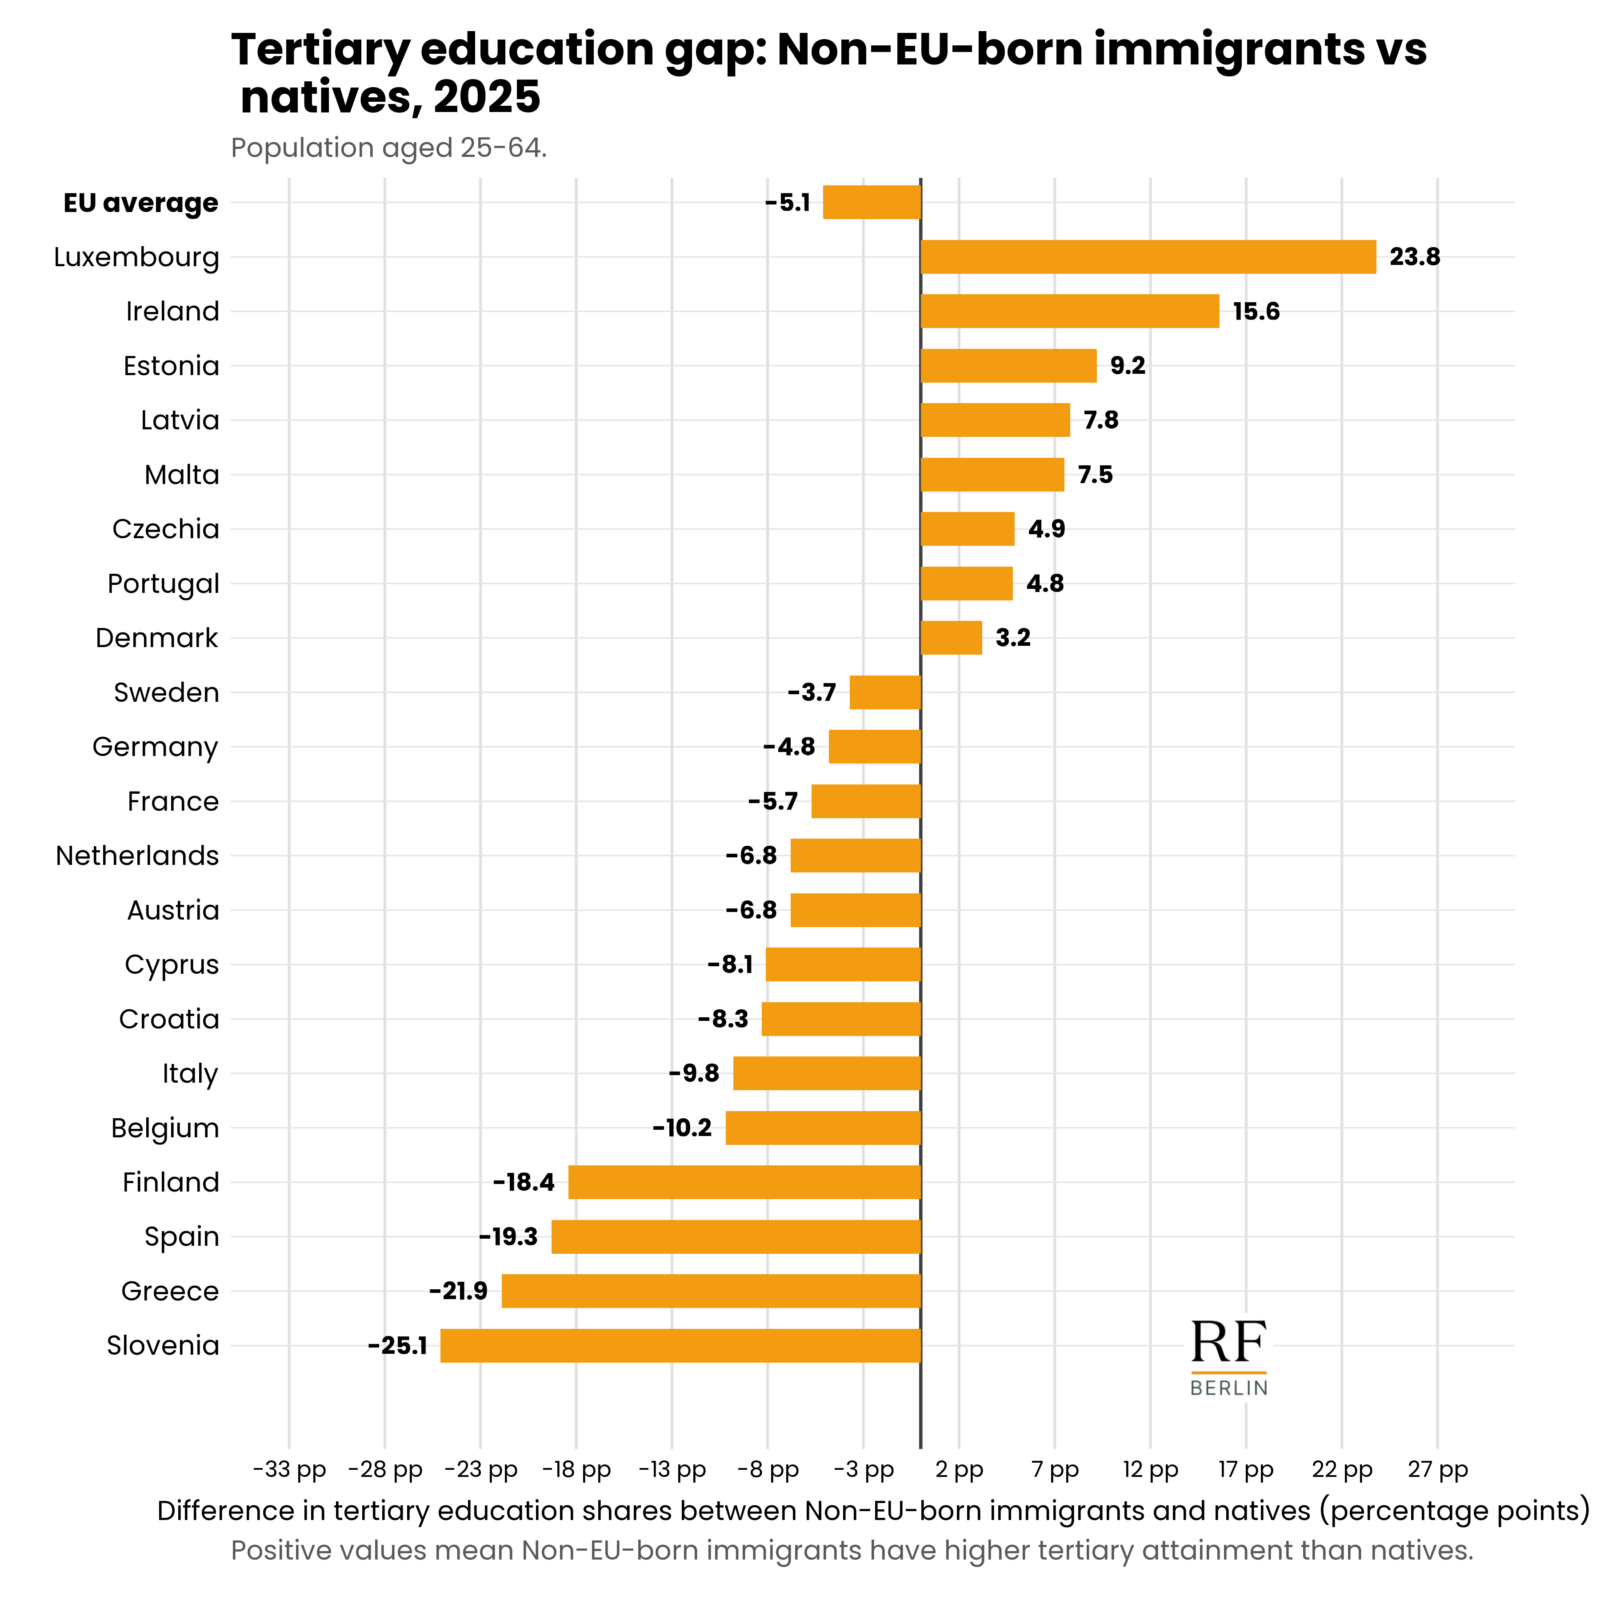
Source: Own computation based on data from Eurostat, lfsa_ergaedcob (downloaded on 22nd April 2026). Notes: Countries are included if the foreign-born population accounts for at least 10% of the total population. The EU average is the Eurostat EU27 aggregate and includes all EU27 countries. Countries are ordered by the gap between non-EU-born immigrants and natives, from the most positive to the most negative gap.
Ireland provides one of the clearest examples of why distinguishing between EU-born and non-EU-born immigrants matters. While EU-born immigrants in Ireland have a tertiary attainment rate very close to natives, non-EU-born immigrants have substantially higher rates. This suggests that the aggregate immigrant advantage observed for Ireland in Figure 5 is largely driven by the non-EU-born population (See Box 1 for additional discussion of the Irish case).
In the other countries, however, non-EU-born immigrants have lower tertiary attainment than natives. The largest negative gaps are observed in Slovenia (-25.1 percentage points relative to natives), Greece (-21.9 percentage points), Spain (-19.3 percentage points), and Finland (-18.4 percentage points). Belgium, Italy, Croatia, Cyprus, Austria, and the Netherlands also show negative gaps, generally ranging between -7 and -10 percentage points.
Box 1. Ireland: Why Do Non-EU Immigrants Have Particularly High Tertiary Attainment?
Ireland stands out as one of the clearest exceptions in the EU comparison. In 2025, natives and EU-born immigrants displayed the same tertiary attainment rate, at 55.1%, while the share of non-EU-born immigrants with tertiary education reached 70.7%. In other words, non-EU-born immigrants in Ireland were substantially more likely than both natives and EU-born immigrants to hold tertiary qualifications.
One important reason for this peculiarity is that non-EU migration to Ireland is strongly shaped by highly skilled labour migration. Ireland’s Critical Skills Employment Permit is specifically designed to attract qualified non-EEA workers into occupations facing labour shortages, particularly in sectors such as information and communication technology (ICT), engineering, healthcare, and specialised professional services. Many of these occupations require high levels of formal education. For instance, in 2023, 89% of workers in ICT roles held tertiary qualifications.
This channel has become increasingly important in recent years. In 2024, Ireland issued more than 32,000 new employment permits (about 6 new employment permits per 1,000 residents), and over half of them were Critical Skills Employment Permits. While not all non-EU migrants enter Ireland through highly skilled pathways, the design and scale of the Critical Skills permit system show that skilled labour migration forms a major component of non-EU immigration.
According to the National Skills Bulletin 2024, ICT occupations recorded the fastest employment growth in the Irish economy between 2018 and 2023, and non-Irish citizens account for around two-fifths of employment in ICT occupations, the highest share across all occupational groups. Persistent shortages of software developers, IT analysts, engineers, and related professionals therefore create strong demand for highly educated international workers.
A second important factor is international higher education. Ireland has actively positioned itself as a destination for international students and researchers through its Global Citizens 2030 strategy. In parallel, the Third Level Graduate Programme allows non-EEA graduates from Irish universities to remain in the country after completing their studies and transition into graduate-level employment or skilled work permits.
Figure A.1 further illustrates the growing importance of work- and study-related migration channels in Ireland. By 2024, employment-related residence permits among third-country nationals had reached 95.8 thousand (29% of all valid permits), while education-related permits stood at 68.3 thousand (21% of all valid permits), both substantially above permits linked to refugee status or subsidiary protection in these statistics.
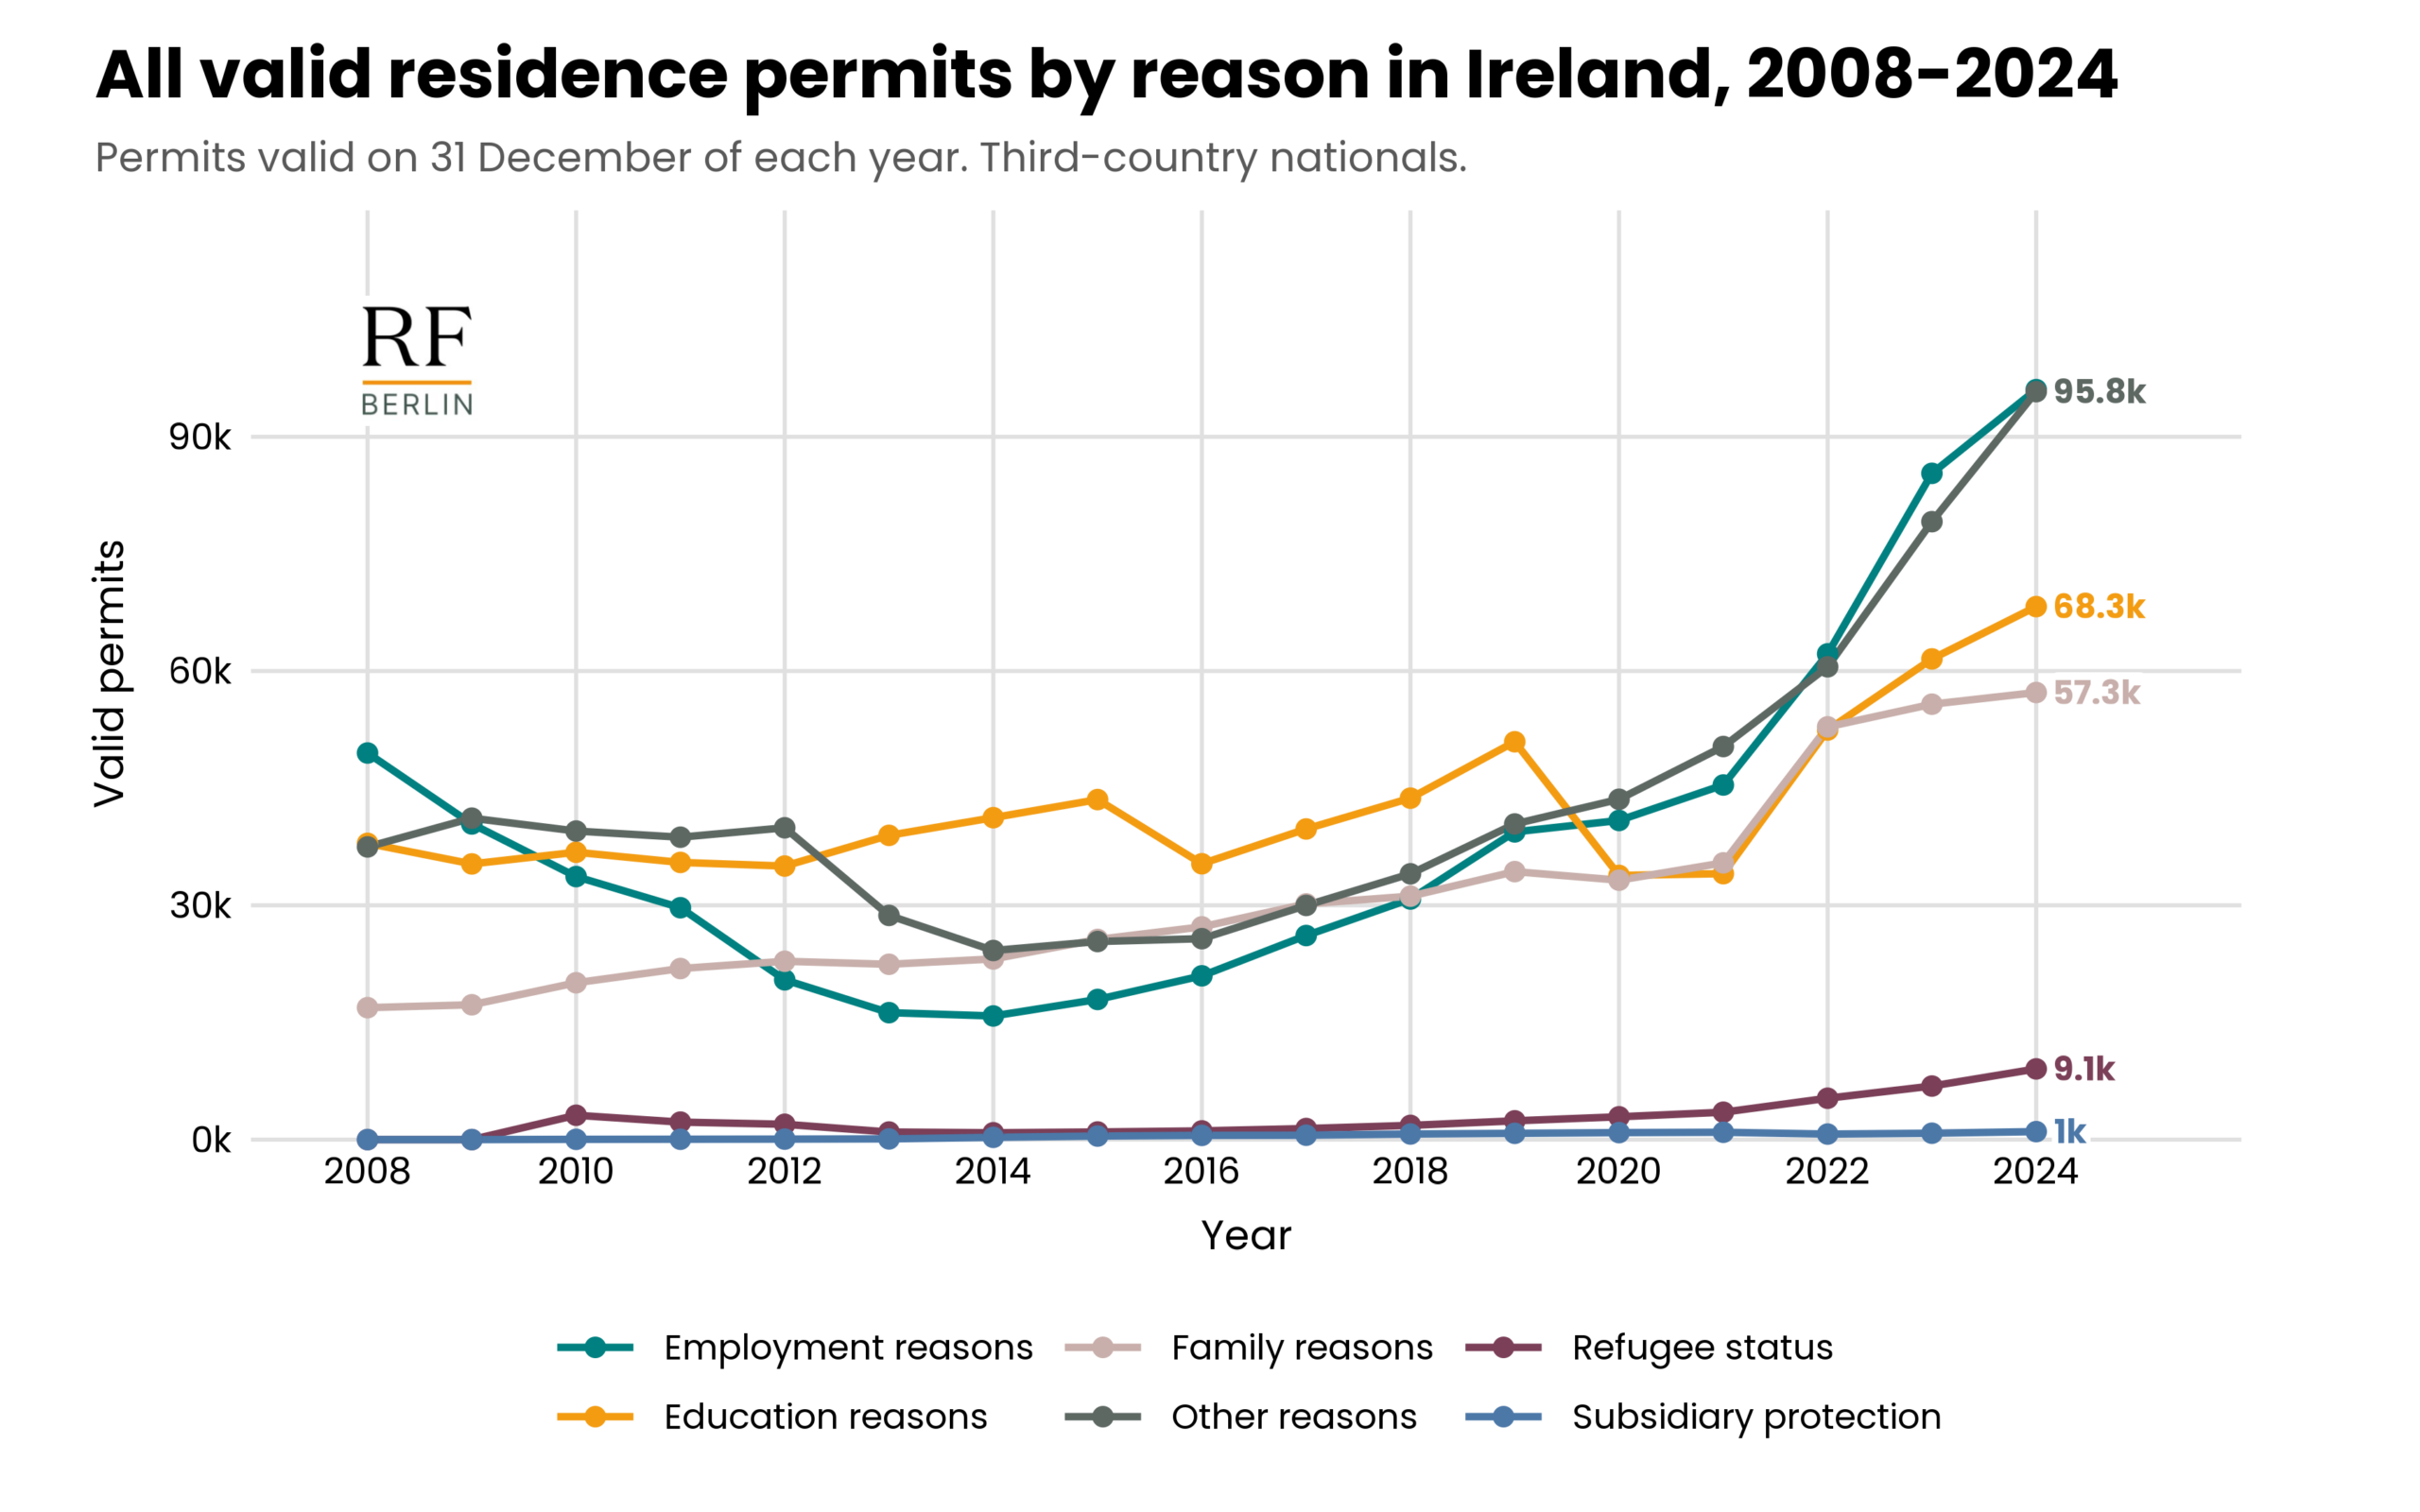
Source: Own computation based on data from Eurostat, migr_resvalid (downloaded on 5th May 2026). Temporary protection is not included in residence permit statistics. This matters for Ireland because some recent arrivals, including people displaced from Ukraine, may not be captured in these residence permit categories.
Department of Enterprise, Tourism and Employment. “Critical Skills Employment Permit.”
Department of Enterprise, Tourism and Employment. “Highest ever number of employment permits issued in 2024.” Published 29 December 2024.
SOLAS. National Skills Bulletin 2024. Section 10.2, “ICT Occupations,” pp. 143-145.
Department of Further and Higher Education, Research, Innovation and Science. Global Citizens 2030: Ireland’s Talent and Innovation Strategy. Published 15 January 2024.
Immigration Service Delivery. “Third Level Graduate Programme.” Last updated 28 March 2024.
Gender Gaps in Tertiary Education
Women display higher tertiary attainment than men across all major population groups in the EU, but the size of this female advantage varies substantially across countries and origin groups. At the EU level, the gender gap is larger among natives than among immigrants overall. However, once distinguishing between EU-born and non-EU-born immigrants, important cross-country differences emerge, revealing a far more diverse picture than aggregate averages alone suggest.
As shown earlier in Figure 3, women have higher tertiary attainment than men among natives, EU-born immigrants, and non-EU-born immigrants alike. Figure 8 extends this analysis to the country level by comparing gender gaps in higher education rates among natives and immigrants across the EU. Positive values indicate that women have higher tertiary attainment than men within the same population group.
At the EU level, the gender gap amounts to +4.5 percentage points among immigrants overall, compared with +6.9 percentage points among natives. Yet behind these averages lie markedly different national patterns.
In most countries, the educational advantage of women is stronger among natives than among immigrants. However, a smaller group of countries displays the opposite pattern, with larger gender gaps among immigrant populations. Malta provides one of the clearest examples: the gender gap reaches +14.2 percentage points among immigrants, compared with +7.9 percentage points among natives. A similar pattern appears in Greece, where the gap stands at +10.9 among immigrants versus +5.8 among natives.
In other countries, differences between groups are relatively limited. In Ireland, the gender gap amounts to +7.1 percentage points among immigrants and +8.4 among natives. Comparable patterns are observed in Czechia (+7.3 versus +7.5) and the Netherlands (+3.6 versus +4.4), where gender differences remain broadly similar across population groups.
Germany stands out as a notable exception. Among natives, the gender gap is negative (-4.8 percentage points), indicating higher tertiary attainment among men than among women. Among immigrants, however, the pattern remains positive, with women exceeding men by +3.0 percentage points.
By contrast, several countries display substantially larger gender gaps among natives than among immigrants. Estonia is particularly striking, with a gap of +23.5 percentage points among natives compared with +16.2 among immigrants. Similar differences appear in Sweden (+18.4 among natives versus +8.3 among immigrants), Finland (+18.1 versus +2.2), and Latvia (+21.2 versus +6.5).
Figure 8
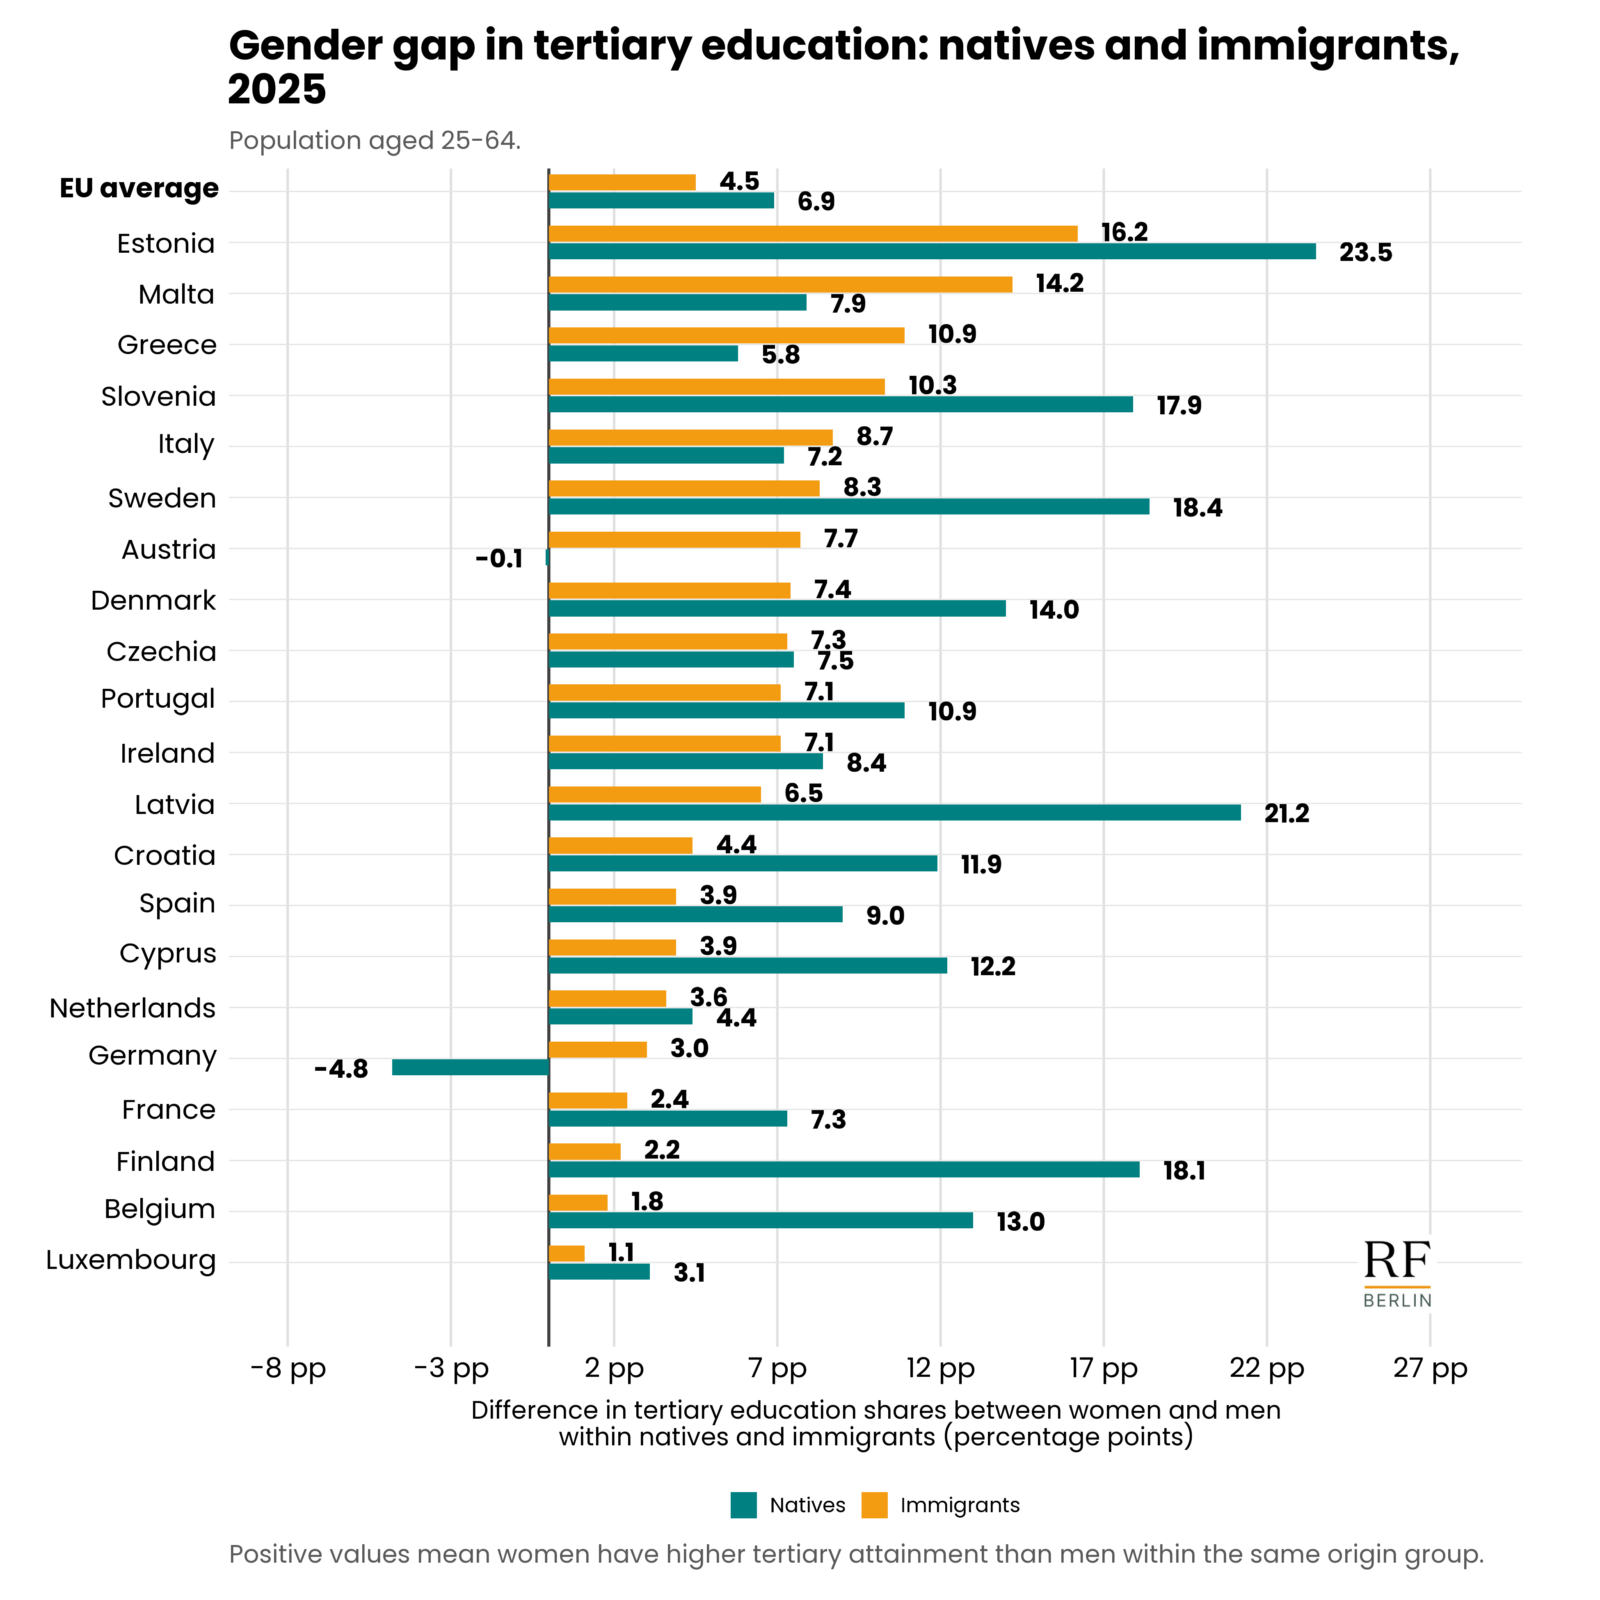
Source: Own computation based on Eurostat, lfsa_ergaedcob (downloaded on 22nd April 2026). Notes: Countries are included if the foreign-born population accounts for at least 10% of the total population. The EU average is the Eurostat EU27 aggregate and includes all EU27 countries. The figure is ordered by the size of the gender gap among immigrants, highlighting where the female advantage is most pronounced in this group.
Distinguishing between immigrants from different origins reveals additional differences (Figure 9). At the EU level, the gender gap is relatively similar across both EU (+4.2 percentage points) and non-EU (+4.5 percentage points).
Figure 9
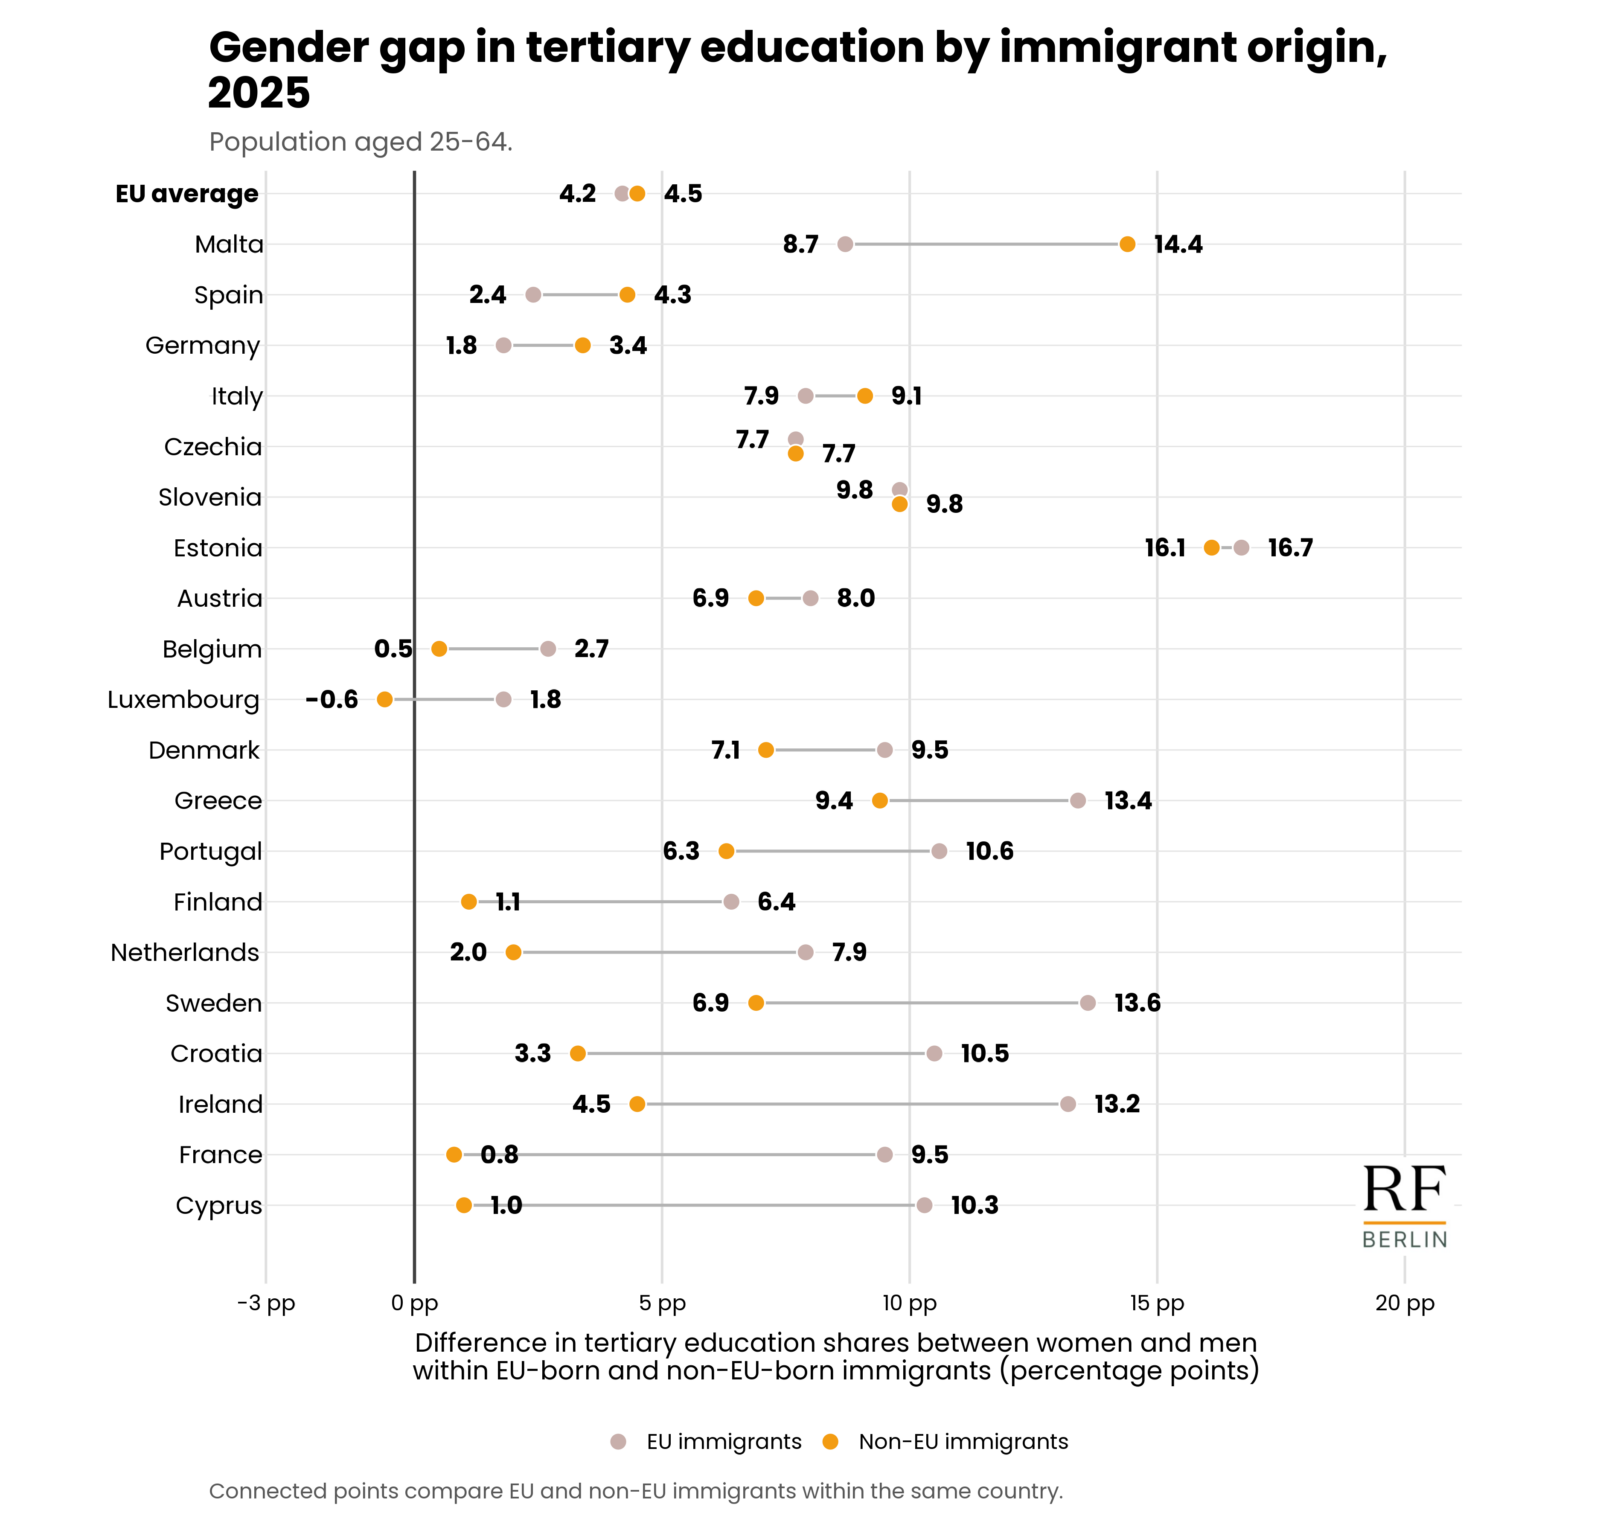
Source: Own computation based on data from Eurostat, lfsa_ergaedcob (downloaded on 22nd April 2026). Notes: Countries are included if the foreign-born population accounts for at least 10% of the total population. The EU average is the Eurostat EU27 aggregate and includes all EU27 countries. Countries are ordered by the difference between the non-EU-born immigrant gender gap and the EU-born immigrant gender gap, from countries where the gender gap is relatively larger among EU-born immigrants to countries where it is relatively larger among non-EU-born immigrants. Latvia is excluded from this figure because the required gender-specific data for EU-born and non-EU-born immigrants are not available.
At the country level, however, the comparison differs considerably, although in all countries and for both immigrant groups – except for non-EU immigrants in Luxembourg – tertiary education rates are higher for women than for men.
The female advantage is larger among non-EU-born immigrants than among EU-born immigrants only in a few countries: Malta (+14.4 versus +8.7 among EU-born immigrants), Spain (+4.3 versus +2.4), Germany (+3.4 versus +1.8), and Italy (+9.1 versus +7.9). In Czechia and Slovenia, the gender gap is virtually identical across the two immigrant groups.
In the remaining countries, the gender gap is larger among EU-born immigrants. The difference between the two immigrant groups is especially large in Cyprus (+10.3 among EU-born immigrants versus +1.0 among non-EU-born immigrants), France (+9.5 versus +0.8), Ireland (+13.2 versus +4.5), Croatia (+10.5 versus +3.3), and Sweden (+13.6 versus +6.9). This means that, in most countries shown, the female advantage in tertiary attainment is stronger among EU-born immigrants than among non-EU-born immigrants.
Within-Sex Comparisons: Origin Gaps Among Men and Women
Comparing within the same sex shows that immigrant-native education gaps are not only driven by gender composition. At the EU level, both immigrant men and immigrant women have lower tertiary attainment than natives of the same sex, with larger negative gaps among non-EU-born immigrants; however, the country-level patterns differ: positive gaps are more common among immigrant men, while immigrant women, especially non-EU-born women, more often fall below native women.
Another way of looking at gender differences is to compute gender-specific immigrant-native gaps in the share of population with tertiary education. Among men, both EU-born and non-EU-born immigrants have slightly lower tertiary attainment than native men, on average across the EU27 (see Figure 10). The gap amounts to -0.5 percentage points for EU-born immigrant men and -3.9 percentage points for non-EU-born immigrant men.
Figure 10
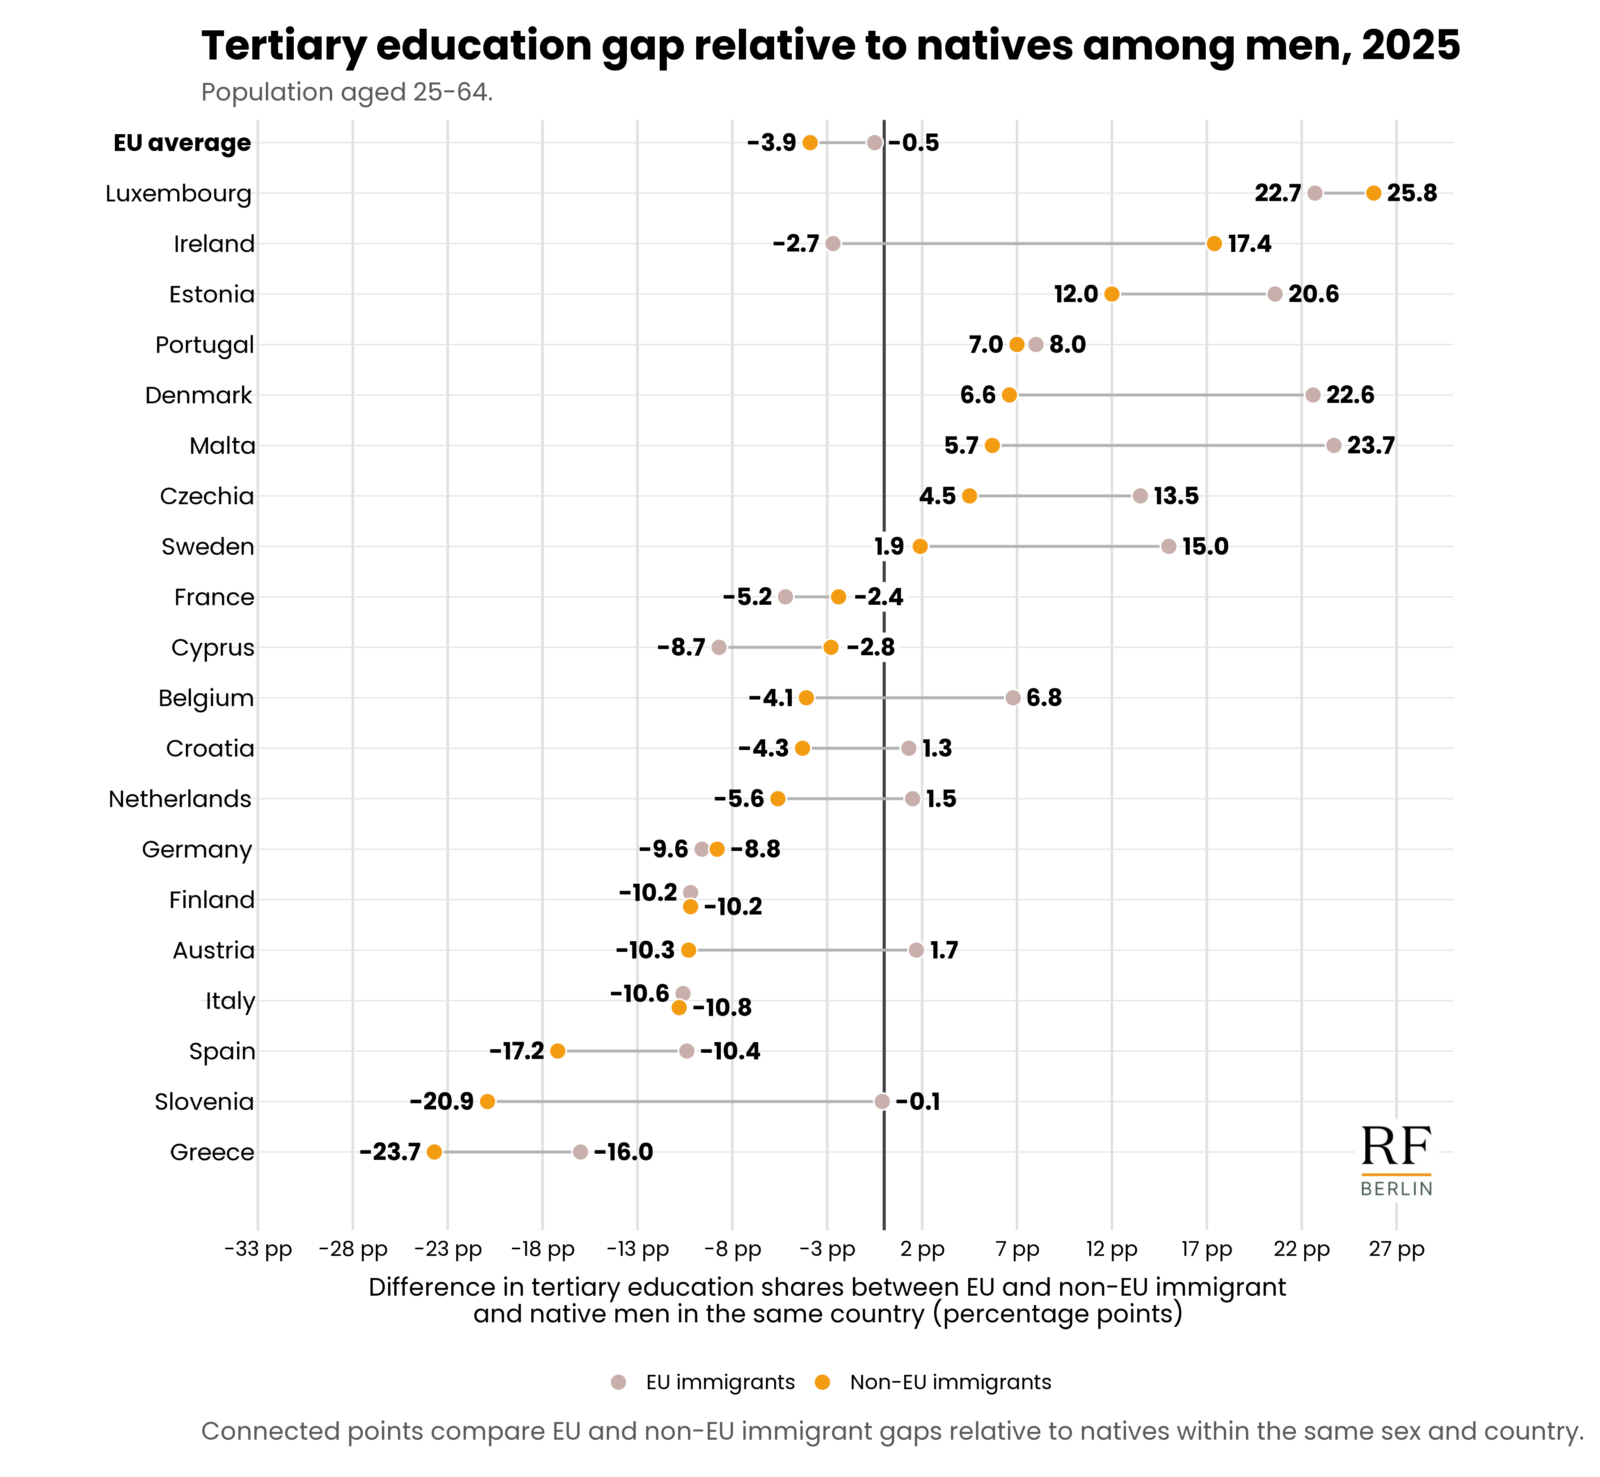
Source: Own computation based on data from Eurostat, lfsa_ergaedcob (downloaded on 22nd April 2026). Notes: Countries are included if the foreign-born population accounts for at least 10% of the total population. The EU average is the Eurostat EU27 aggregate and includes all EU27 countries. Men are compared within the same sex group; countries are ordered by the non-EU-born immigrant gap relative to native men. Latvia is excluded from this figure because the required data for the same-sex comparison among men are not available.
Despite these EU-level gaps, several countries show higher tertiary attainment among immigrant men than among native men. This pattern is particularly pronounced in Luxembourg, where EU-born immigrant men exceed natives by +22.7 percentage points and non-EU-born immigrant men by +25.8 percentage points. Similar patterns appear in Estonia (+20.6 versus +12.0), Portugal (+8.0 versus +7.0) Denmark (+22.6 versus +6.6), Malta (+23.7 versus +5.7), and Czechia (+13.5 versus +4.5), although in most of these cases the advantage is stronger among EU-born immigrants.
In many other countries, however, both immigrant groups fall below natives. This is the case in Greece (-16.0 versus -23.7), Spain (-10.4 percentage points for EU-born immigrants versus -17.2 for non-EU-born immigrants), and Italy (-10.6 versus -10.8), as well as in Austria and Finland. Only in a few countries – notably France, Cyprus, and, to a lesser extent, Germany – do EU-born immigrant men display lower tertiary attainment than non-EU-born immigrant men within this broader group of disadvantaged countries.
Some countries also display sharply contrasting patterns between immigrant-origin groups. Ireland stands out in this respect: EU-born immigrant men are slightly below native men (-2.7 percentage points), whereas non-EU-born immigrant men are substantially above them (+17.4). Similar contrasts can be observed in Croatia and the Netherlands, where male EU-born immigrants are close to or below native, while male non-EU-born immigrants perform somewhat better.
Among women, negative gaps relative to natives are even more widespread (Figure 11). At the EU level, EU-born immigrant women display tertiary attainment rates 3.2 percentage points below those of native women, while the gap reaches -6.3 percentage points among non-EU-born immigrant women.
Figure 11
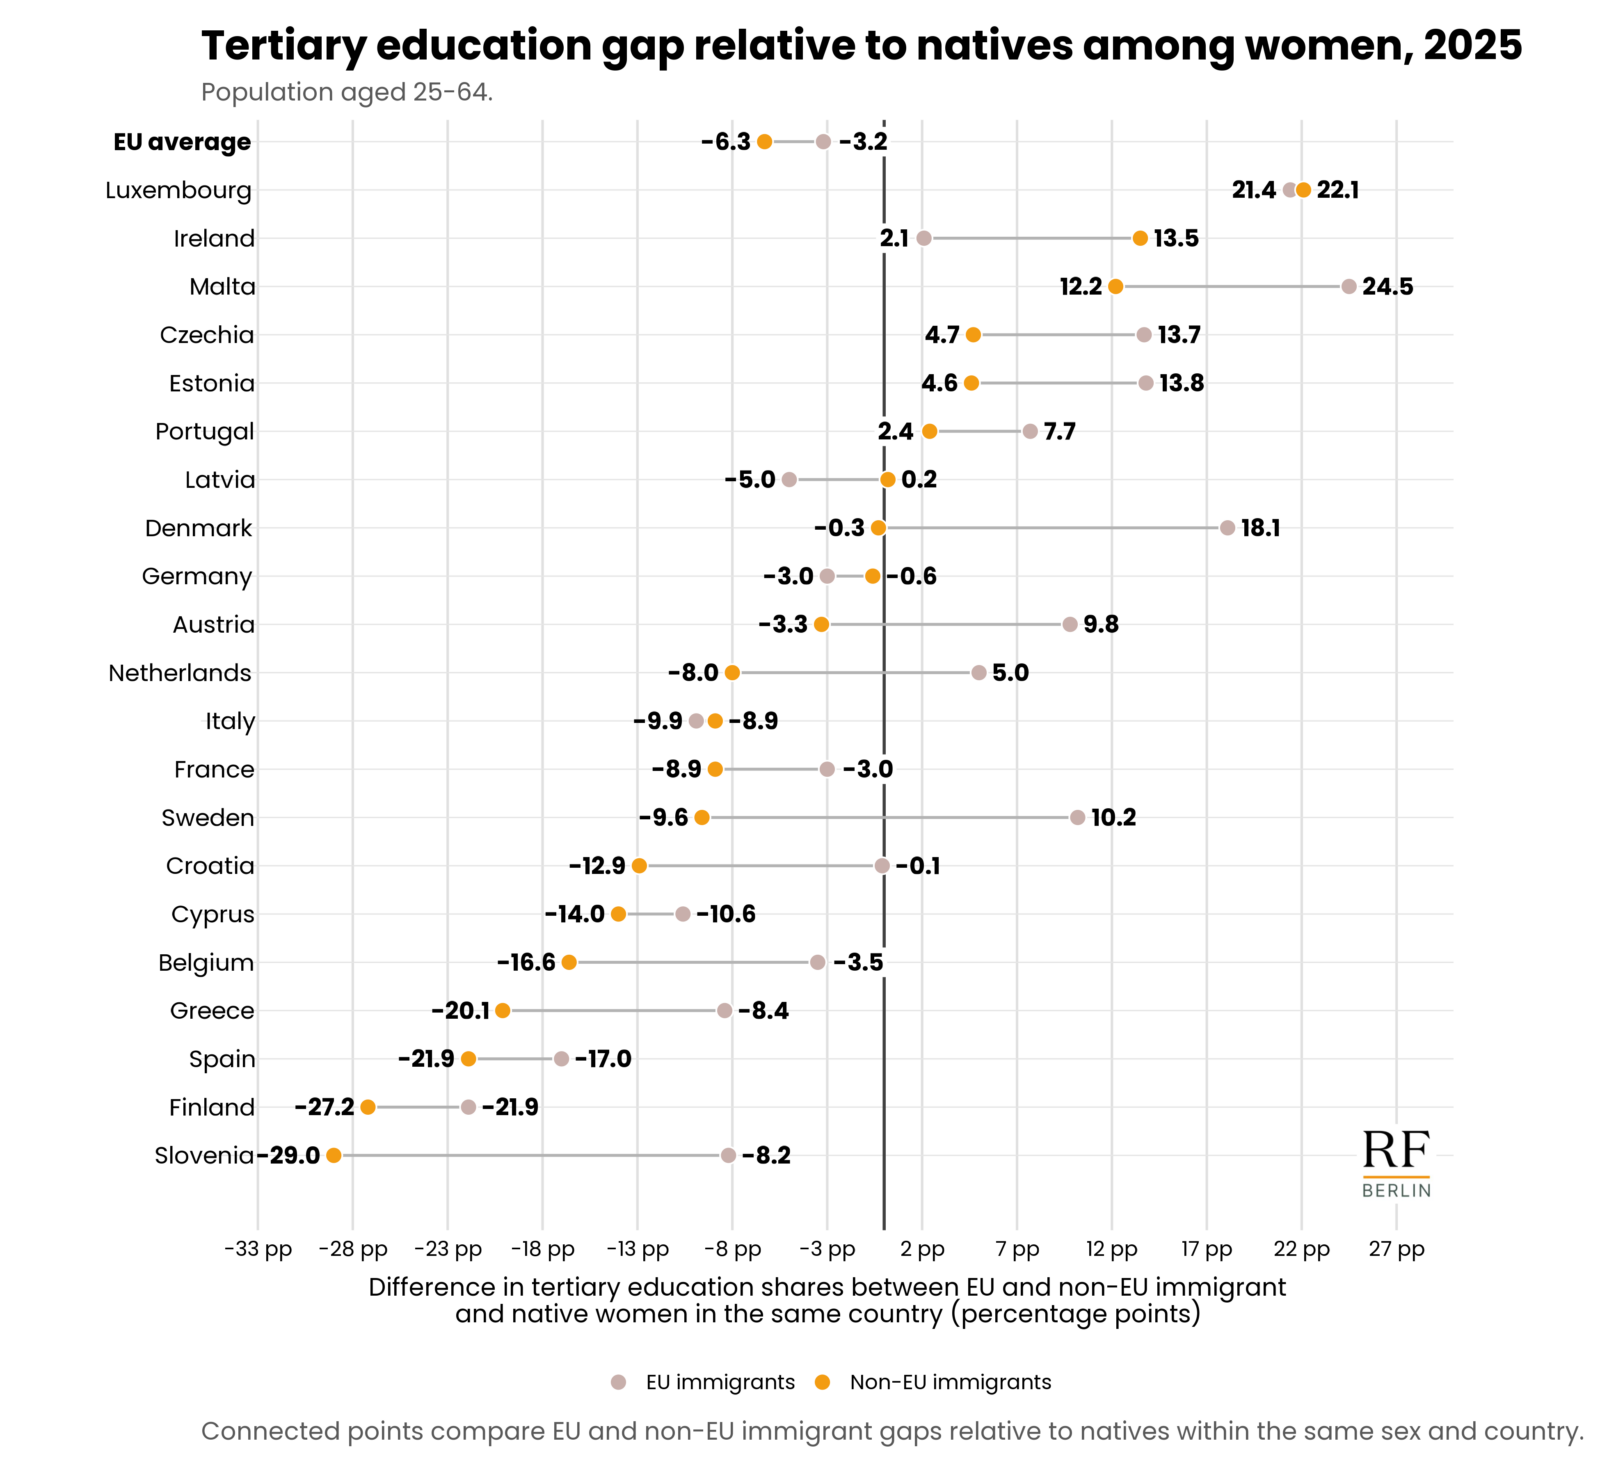
Source: Own computation based on Eurostat, lfsa_ergaedcob (downloaded on 22nd April 2026). Notes: Countries are included if the foreign-born population accounts for at least 10% of the total population. The EU average is the Eurostat EU27 aggregate and includes all EU27 countries. Women are compared within the same sex group; countries are ordered by the non-EU-born immigrant gap relative to native women.
Only a small number of countries display higher tertiary attainment among both groups of immigrant women compared with native women. This includes Luxembourg (+21.4 percentage points for EU-born immigrants and +22.1 for non-EU-born immigrants), Ireland (+2.1 versus +13.5), and Malta (+24.5 versus +12.2), although in most countriesthe advantage is stronger among EU-born immigrant women.
In many countries, however, immigrant women – particularly those born outside the EU – remain below natives in tertiary attainment. Large negative gaps are observed in Spain (-17.0 percentage points for EU-born immigrants versus -21.9 for non-EU-born immigrants), Greece (-8.4 versus -20.1), Italy (-8.9 versus -9.9), and Cyprus (-10.6 versus -14.0), as well as in Finland (-21.9 versus -27.2) and Slovenia (-8.2 versus -29.0).
As observed among men, several countries display diverging patterns between immigrant-origin groups. In Denmark, EU-born immigrant women display much higher tertiary attainment than native women (+18.1 percentage points), while non-EU-born immigrant women are close to parity (-0.3). Sweden shows an even sharper contrast: EU-born immigrant women exceed natives by +10.2 percentage points, whereas non-EU-born immigrant women fall below natives by -9.6 percentage points.
Conclusion
Tertiary educational attainment has continued to expand across the European Union, rising steadily among natives, EU-born immigrants, and non-EU-born immigrants alike. The results presented in this report nevertheless show that important differences by origin remain visible. EU-born immigrants tend to display educational outcomes relatively close to those of natives, while non-EU-born immigrants generally show lower average tertiary attainment and a more polarised educational structure, combining larger shares of both low- and highly educated individuals.
The analysis also highlights the importance of looking beyond EU-wide averages. Cross-country differences are substantial. In some Member States, immigrants display higher tertiary attainment than natives, while in others the opposite pattern prevails. These differences emerge for both EU-born and non-EU-born immigrants, although negative gaps are generally more frequent and larger among the latter group. Particularly large disadvantages are concentrated in countries such as Finland, Greece, Slovenia, and Spain, whereas positive immigrant-native gaps are observed in a smaller set of countries, including Luxembourg, Ireland, Malta, and Denmark.
Gender constitutes another important dimension of these patterns. Across most countries and population groups, women display higher tertiary attainment than men. Yet the magnitude of this female advantage varies considerably depending on both country context and immigrant origin. In countries such as Sweden, Finland, and Latvia, gender gaps are substantially larger among natives, whereas in countries including Malta and Greece the female advantage is more pronounced among immigrants, particularly among non-EU-born immigrant populations.
Comparisons within the same sex further show that immigrant-native differences cannot be explained solely by gender composition. At the EU level, both immigrant men and immigrant women tend to have lower tertiary attainment than natives of the same sex, with larger disadvantages generally observed among non-EU-born immigrants. At the same time, countries such as Luxembourg and Ireland stand out for displaying positive attainment gaps for some immigrant groups, while particularly large disadvantages among non-EU-born immigrant women are observed in countries including Slovenia, Finland, and Spain.
Overall, three broad conclusions emerge from the analysis. First, tertiary educational attainment is increasing across all major population groups in the EU. Second, differences by origin remain persistent, particularly between natives and non-EU-born immigrants. Third, these differences vary substantially across countries and between men and women, underlining the importance of considering both national context and population composition when analysing educational attainment across Europe.
Technical Appendix
Definition of Foreign-Born Population
We define as “immigrants” persons residing in a country other than their country of birth. The analysis distinguishes between EU-born immigrants (individuals born in another EU Member State) and non-EU-born immigrants (individuals born outside the European Union).
Included Countries
The EU average figures reported throughout the analysis refer to the Eurostat EU27 aggregate.
When looking at individual member countries, we focus only on EU countries where the foreign-born population accounts for at least 10% of the total population in 2025. Based on this criterion, the sample comprises 20 countries: Austria, Belgium, Croatia, Cyprus, Czechia, Denmark, Estonia, Finland, France, Germany, Greece, Ireland, Italy, Latvia, Luxembourg, Malta, the Netherlands, Slovenia, Spain, and Sweden, whereas Bulgaria, Hungary, Lithuania, Poland, Romania and Slovakia are excluded.
Latvia is excluded from Figure 9 and Figure 10 because the required gender-specific data distinguishing EU-born and non-EU-born immigrants are not available for the relevant indicators. These figures therefore include 19 countries.
Education Categories
This report groups education into three categories based on the ISCED 2011 classification. Low education refers to ISCED levels 0-2, corresponding to less than primary, primary and lower secondary education. Intermediate education refers to ISCED levels 3-4, corresponding to upper secondary and post-secondary non-tertiary education. High (or tertiary) education refers to ISCED levels 5-8, corresponding to short-cycle tertiary, bachelor’s or equivalent, master’s or equivalent, and doctoral or equivalent education. All education indicators in the report refer to the population aged 25-64. This age range is used to focus on the adult working-age population and to reduce the influence of ongoing education among younger age groups.
Coefficient of variation
To assess how much tertiary education rates vary across countries within each gender-origin group, we calculate the coefficient of variation. The coefficient of variation is defined as the cross-country standard deviation (σ) divided by the cross-country mean (μ): ![]() where σ is the unweighted cross-country standard deviation of tertiary education rates and μ is the unweighted cross-country mean for the same gender-origin group.
where σ is the unweighted cross-country standard deviation of tertiary education rates and μ is the unweighted cross-country mean for the same gender-origin group.
Appendix A
Table A.1
| EU Country | Share of tertiary education of natives | Share of tertiary education of EU-born immigrants | Share of tertiary education of non-EU-born immigrants |
|---|---|---|---|
| Cyprus | 55.1 | 45.9 | 47.0 |
| Ireland | 55.1 | 55.1 | 70.7 |
| Sweden | 51.0 | 63.8 | 47.3 |
| Belgium | 48.9 | 50.7 | 38.7 |
| Spain | 47.0 | 33.5 | 27.7 |
| Netherlands | 46.9 | 50.5 | 40.1 |
| France | 45.8 | 41.9 | 40.1 |
| Finland | 45.4 | 29.2 | 27.0 |
| Denmark | 45 | 65.1 | 48.2 |
| Luxembourg | 41.9 | 63.8 | 65.7 |
| Estonia | 40.6 | 57.5 | 49.8 |
| Latvia | 40.0 | 42.3 | 47.8 |
| Slovenia | 38.6 | 34.8 | 13.5 |
| Austria | 38.0 | 44.0 | 31.2 |
| EU average | 37.7 | 36.0 | 32.6 |
| Greece | 36.8 | 26.6 | 14.9 |
| Germany | 36.7 | 30.4 | 31.9 |
| Malta | 33.0 | 57.1 | 40.5 |
| Croatia | 31.8 | 32.7 | 23.5 |
| Portugal | 31.8 | 40.3 | 36.6 |
| Czechia | 28.1 | 41.7 | 33.0 |
| Italy | 23.9 | 14.5 | 14.1 |
Source: Own computation based on Eurostat, lfsa_ergaedcob (downloaded on 22nd April 2026). Notes: The table reports the share of the population aged 25-64 with tertiary education, by population group. Countries are ordered by the share of natives with tertiary education, from highest to lowest. The EU average is the Eurostat EU27 aggregate. Countries are included if the foreign-born population accounts for at least 10% of the total population.