
Summary
- The EU is home to a record number of foreign-born residents, reaching approximately 64 million in 2025.
- Growth remained strong in 2025 (+2.1 million) although below the exceptional increase recorded in 2023–2024 (+2.6 million). Spain recorded the fastest growth among major EU countries in 2025, accounting for roughly one-third of the EU-wide increase.
- Germany remains the main destination in absolute terms, but smaller countries show much higher relative exposure.
- Recent migration flows are highly concentrated, with Spain and Germany accounting for nearly half of new arrivals in 2024, while smaller states such as Malta, Cyprus, and Luxembourg recorded the highest inflows relative to population.
- Asylum applications are highly concentrated: Spain, Italy, France and Germany received nearly three‑quarters of all first‑instance applications in 2025, each with distinct origin-country profiles.
- The distribution of refugees highlights a key divide between absolute capacity and relative burden across EU countries.
- Germany hosts by far the largest number of refugees in absolute terms, while Cyprus stands out as the country with the highest refugee share relative to its population.
The Big Picture: Immigration in the European Union Today
Immigration in the European Union (EU) has reached historically high levels. Over the past fifteen years, the EU’s foreign-born population has expanded substantially, reflecting both long-term migration trends and major recent displacement episodes. This report draws on official Eurostat and UNHCR data to track these developments and explain what they mean for the EU’s largest economies and its smaller Member States.
The EU’s foreign‑born population increased from around 40 million in 2010 to roughly 64 million in 2025.[1] Overall, this reflects sustained and substantial long-term growth.
Between 2024 and 2025, the foreign-born population across the EU increased by about 2.1 million (3.4% growth), remaining high by historical standards, although slightly below the 2.6 million increase recorded between 2023 and 2024.
Figure 1 shows the evolution of the immigrant population in the EU between 2010 and 2025 (where we define immigrants as foreign-born individuals, regardless of their reason for migration, see Technical Appendix for details), highlighting key episodes shaping this trend. The 2015 refugee crisis marked a sharp increase in arrivals, with more than 1.25 million first‑time asylum seekers registered in the EU, double the previous year. The COVID‑19 pandemic in 2020 briefly slowed cross‑border movements. More recently, the displacement following Russia’s invasion of Ukraine in 2022 resulted in around 4.35 million people fleeing Ukraine and being under temporary protection in the EU by December 2025.
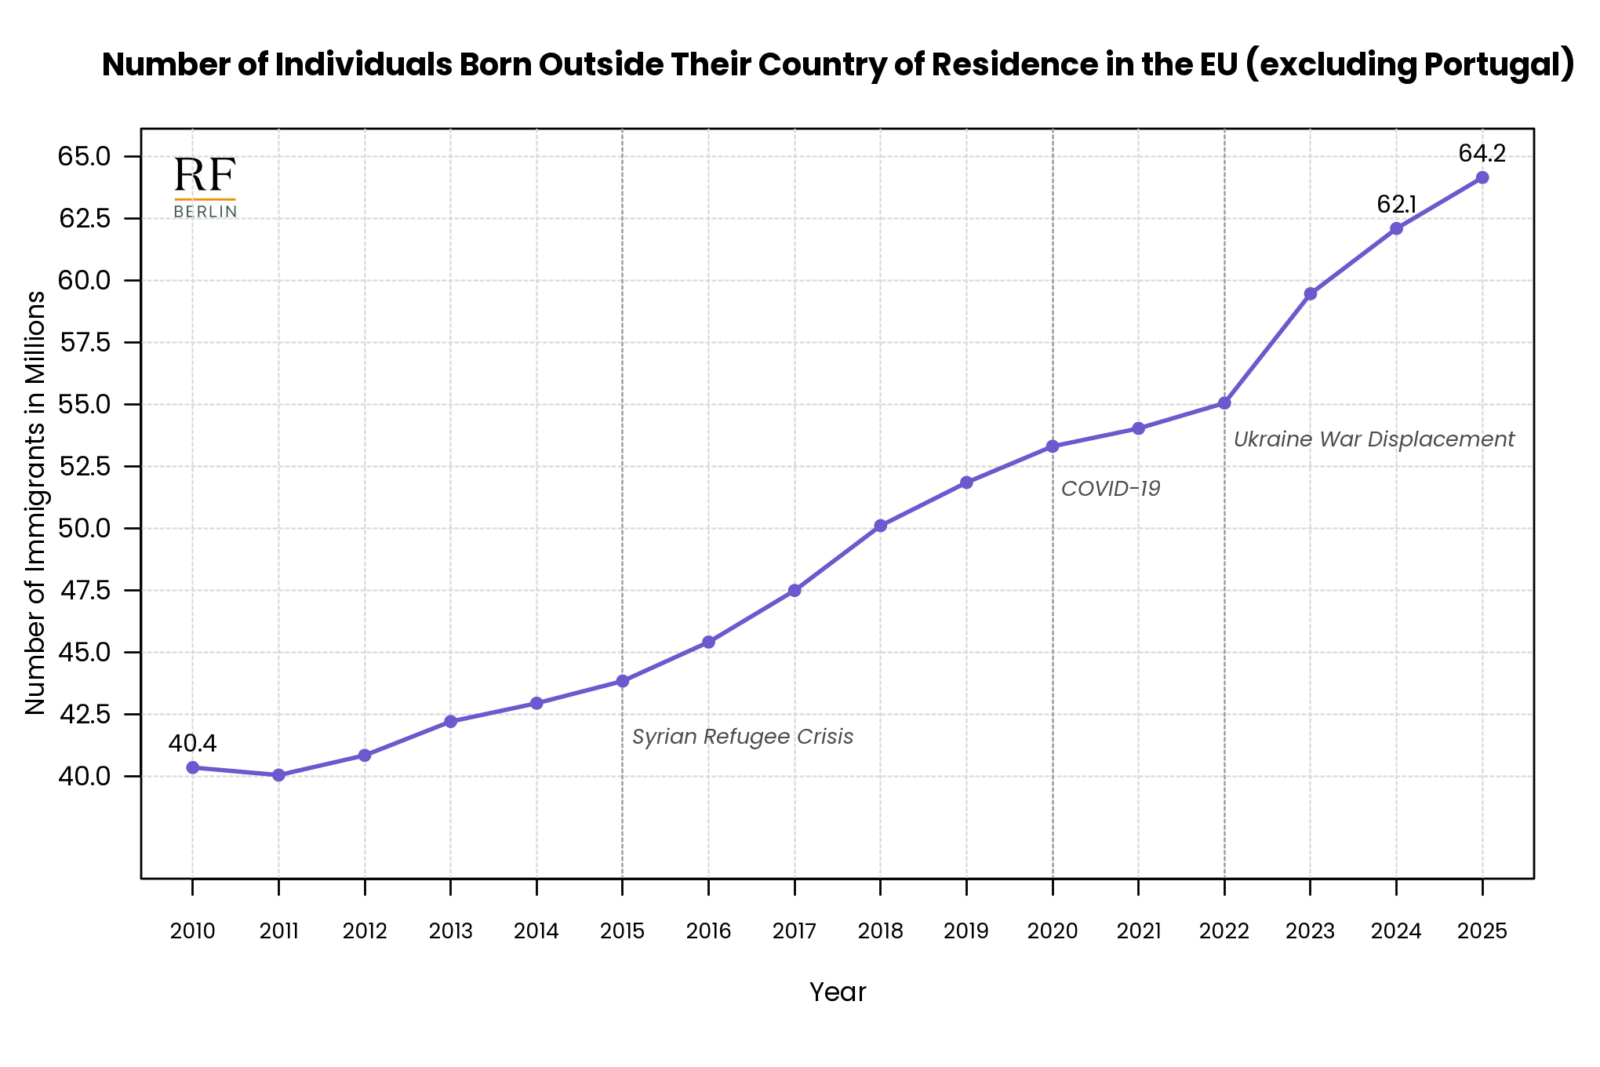
Source: Own computation, based on data from Eurostat, MIGR_POP3CTB (downloaded on 31 March 2026). Notes: The figure reports the number of immigrants on 1 January who reside in the European Union in each year. Immigrants are defined as individuals born in a country other than the one in which they reside, including those with unknown country of birth. The European Union includes all Member States as of 1 February 2020, except for Portugal, which is excluded due to missing data at the time of compiling this report.
Figure 2 focuses on the four largest EU countries – Germany, France, Spain and Italy – together with the aggregate of the remaining Member States. Germany remains the main destination country, with its foreign-born population increasing from around 10 million in 2010 to nearly 18 million in 2025 (approximately +70%). Between 2024 and 2025, Germany’s immigrant population grew by about 300 thousand (1.7%) – half the EU average (3.4%).
Figure 2
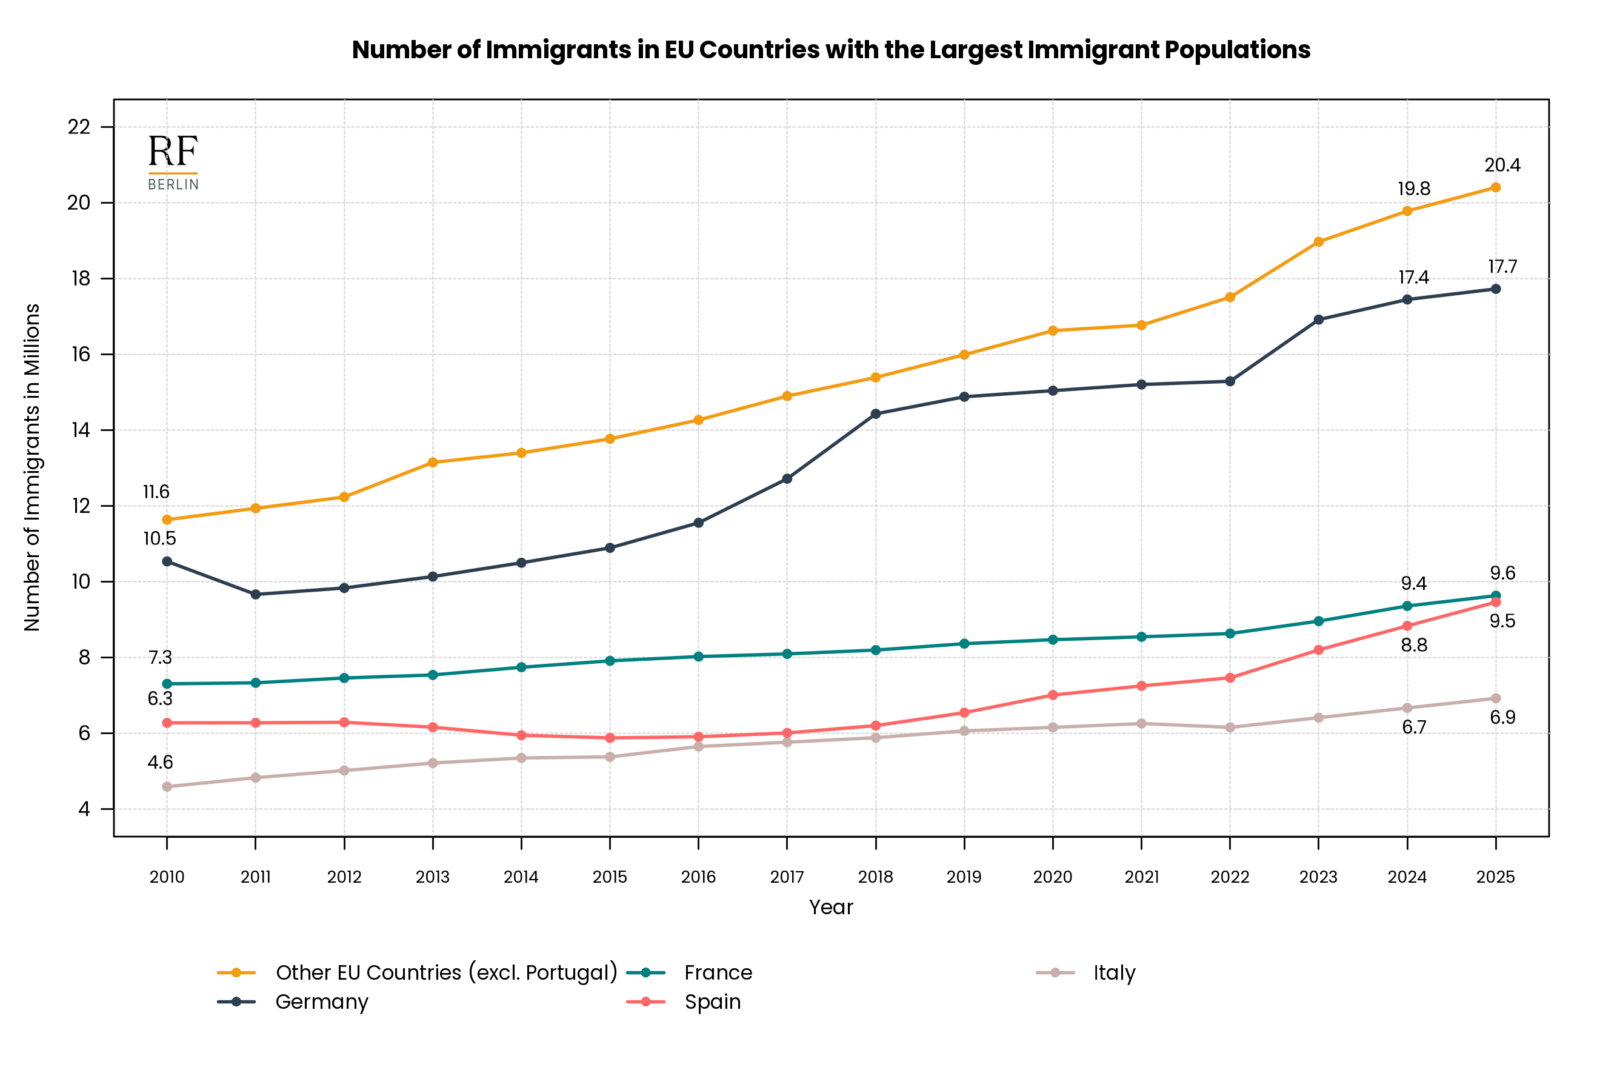
Source: Own computation, based on data from Eurostat, MIGR_POP3CTB (downloaded on 31 March 2026). Notes: The figure reports the number of immigrants on 1 January who reside in the named country in each year. Immigrants are defined as individuals born in a country other than the one in which they reside, including those with unknown country of birth. The European Union includes all Member States as of 1 February 2020, except for Portugal, which is excluded due to missing data at the time of compiling this report.
France and Spain also experienced sustained growth, reaching approximately 9.6 million and 9.5 million foreign-born residents, respectively, in 2025. This corresponds to a more moderate increase in France (around +30%) and a stronger expansion in Spain (around +50%) since 2010. Spain, in particular, recorded a sharp increase in 2025, with its foreign-born population rising from 8.8 to 9.5 million (an 8% increase), more than double the EU average. With an increase of around 700 thousand individuals, Spain accounts for roughly one-third of the total increase in the EU’s foreign-born population in 2025.
Italy experienced more moderate growth, from around 4.6 million in 2010 to approximately 6.9 million in 2025, although its increase between 2024 and 2025 (around 3%) was broadly in line with the EU average. The remaining Member States combined recorded an increase from about 11.6 million to 20.4 million over the same period (around +75%), reflecting a steady upward trend.
Across the EU27, 76% of migrants are of working age (15–64). This share is slightly lower in France (71%) and Germany (72%), whereas in Spain (84%) and Italy (85%) the share of working age migrants is considerably higher than the EU27 average.
While absolute numbers highlight the concentration of migrants in large countries, relative measures provide a different perspective.
Figure 3 reports the share of foreign-born individuals in the total population across EU Member States in 2025. The EU average stands at approximately 14%.
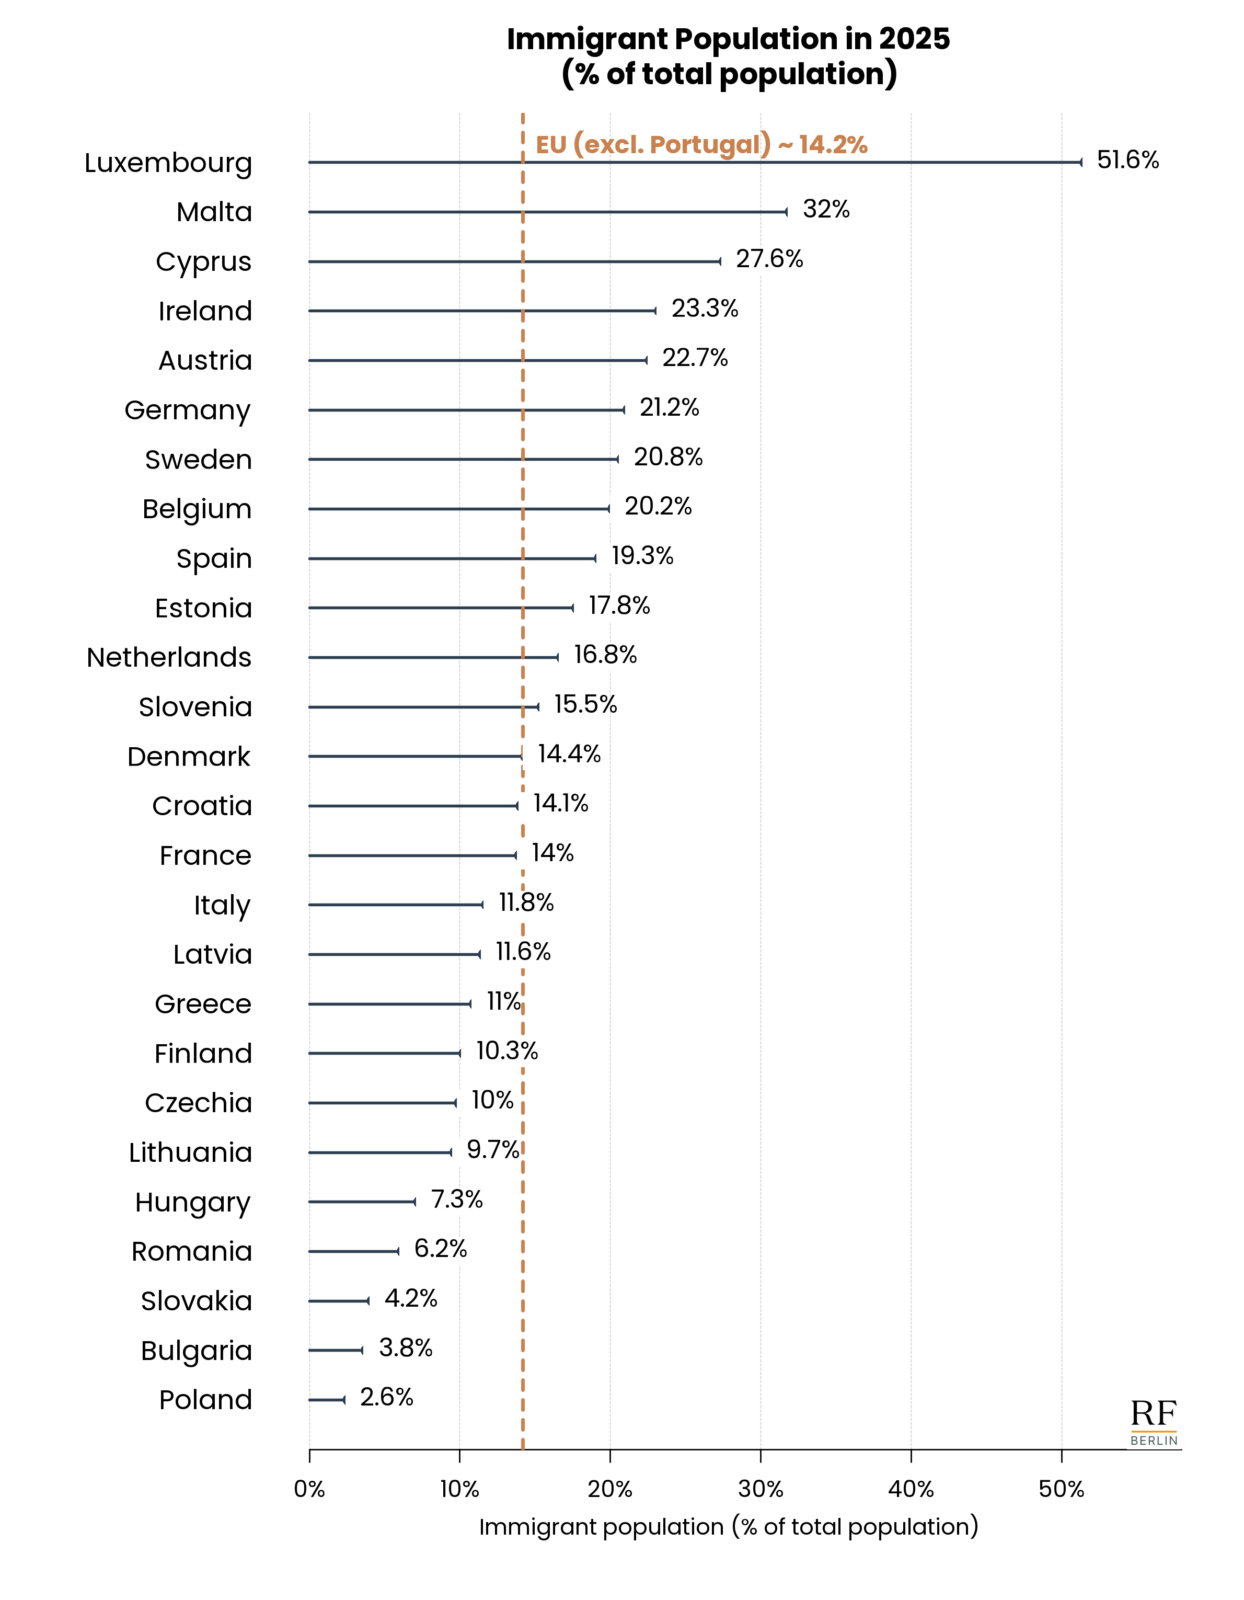
Source: Own computation, based on data from Eurostat, MIGR_POP3CTB (downloaded on 18 March 2026). Notes: The figure reports the share of immigrants in the total population on 1 January. Immigrants are defined as individuals born in a country other than the one in which they reside. The European Union includes all Member States as of 1 February 2020, except for Portugal, which is excluded due to missing data at the time of compiling this report.
Higher shares are predominantly observed in smaller Member States. Luxembourg stands out, with immigrant population accounting for around 52% of its population, followed by Malta (32%) and Cyprus (28%). Ireland and Austria also record relatively high shares, at around 23%.
Among larger countries, Germany displays one of the highest shares, at just above 21%, followed closely by Sweden and Belgium (both around 20%). Spain (19%) and Estonia (18%) are also clearly above the EU average, while the Netherlands (17%) and Slovenia (16%) remain moderately above it.
Denmark, Croatia and France are broadly in line with the EU average. By contrast, Italy, Latvia and Greece record slightly lower shares (around 11-12%), while Finland and Czechia remain close to 10%. At the lower end of the distribution, Lithuania, Hungary and Romania all exhibit shares below 10%, while Slovakia, Bulgaria and Poland show the lowest levels, each below 5%.
Stocks vs. Flows: Where Migrants Live and Where They Arrive
Understanding migration in Europe requires distinguishing between stocks and flows: where migrants currently live, and where they are newly arriving. These two perspectives reveal different, sometimes contrasting, patterns.
Migration inflows into the EU27[2] in 2024 were highly concentrated in a small number of destination countries (Figure 4), highlighting the uneven geography of recent migration trends. Spain and Germany alone absorbed nearly half of all arrivals, with inflows of around 1.22 million and 1.03 million migrants, respectively. A second tier of countries – Italy and France – received significantly lower, but still substantial, numbers (around 410 thousand and 353 thousand arrivals, respectively), followed by Poland (272 thousand) and the Netherlands (234 thousand).
Beyond these main destinations, inflows drop off quickly. A group of countries, including Belgium, Romania, Austria and Czechia recorded moderate levels of arrivals (between 100 and 150 thousand). In countries such as Slovenia, Luxembourg, Estonia, Latvia, and Slovakia, arrivals remained below 30,000.
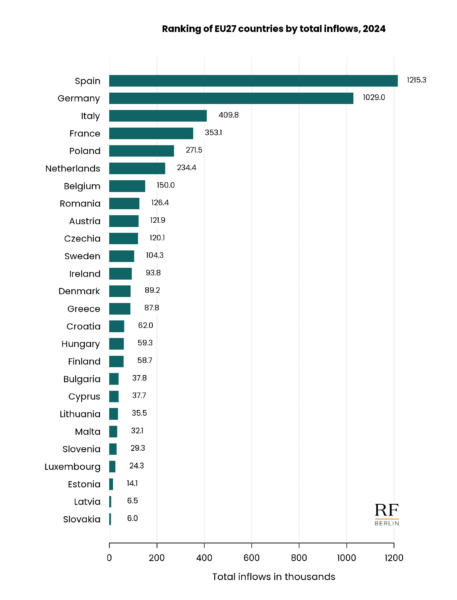
Source: Own computation, based on data from Eurostat, MIGR_IMM3CTB (downloaded on 18 March 2026). Notes: The figure reports the number of migrants (in thousands) who arrived in the named country during the year. Migrants are defined as individuals born in a country other than the one they are living in. Data for Portugal in 2024 are not available at the time of compiling this report.
However, the ranking of countries changes significantly when inflows are calculated relative to population size (Figure 5), revealing a very different geography of migration pressure. While large countries such as Spain and Germany dominate in absolute terms, smaller Member States move to the top of the distribution when inflows are measured per capita. Malta records by far the highest migration intensity, with about 57 arrivals per 1,000 inhabitants, followed by Cyprus (39 per 1,000) and Luxembourg (36 per 1,000). Among larger countries, Spain also stands out, with 25 arrivals per 1,000 inhabitants, while Ireland records relatively high levels at around 17 per 1,000.
Figure 5
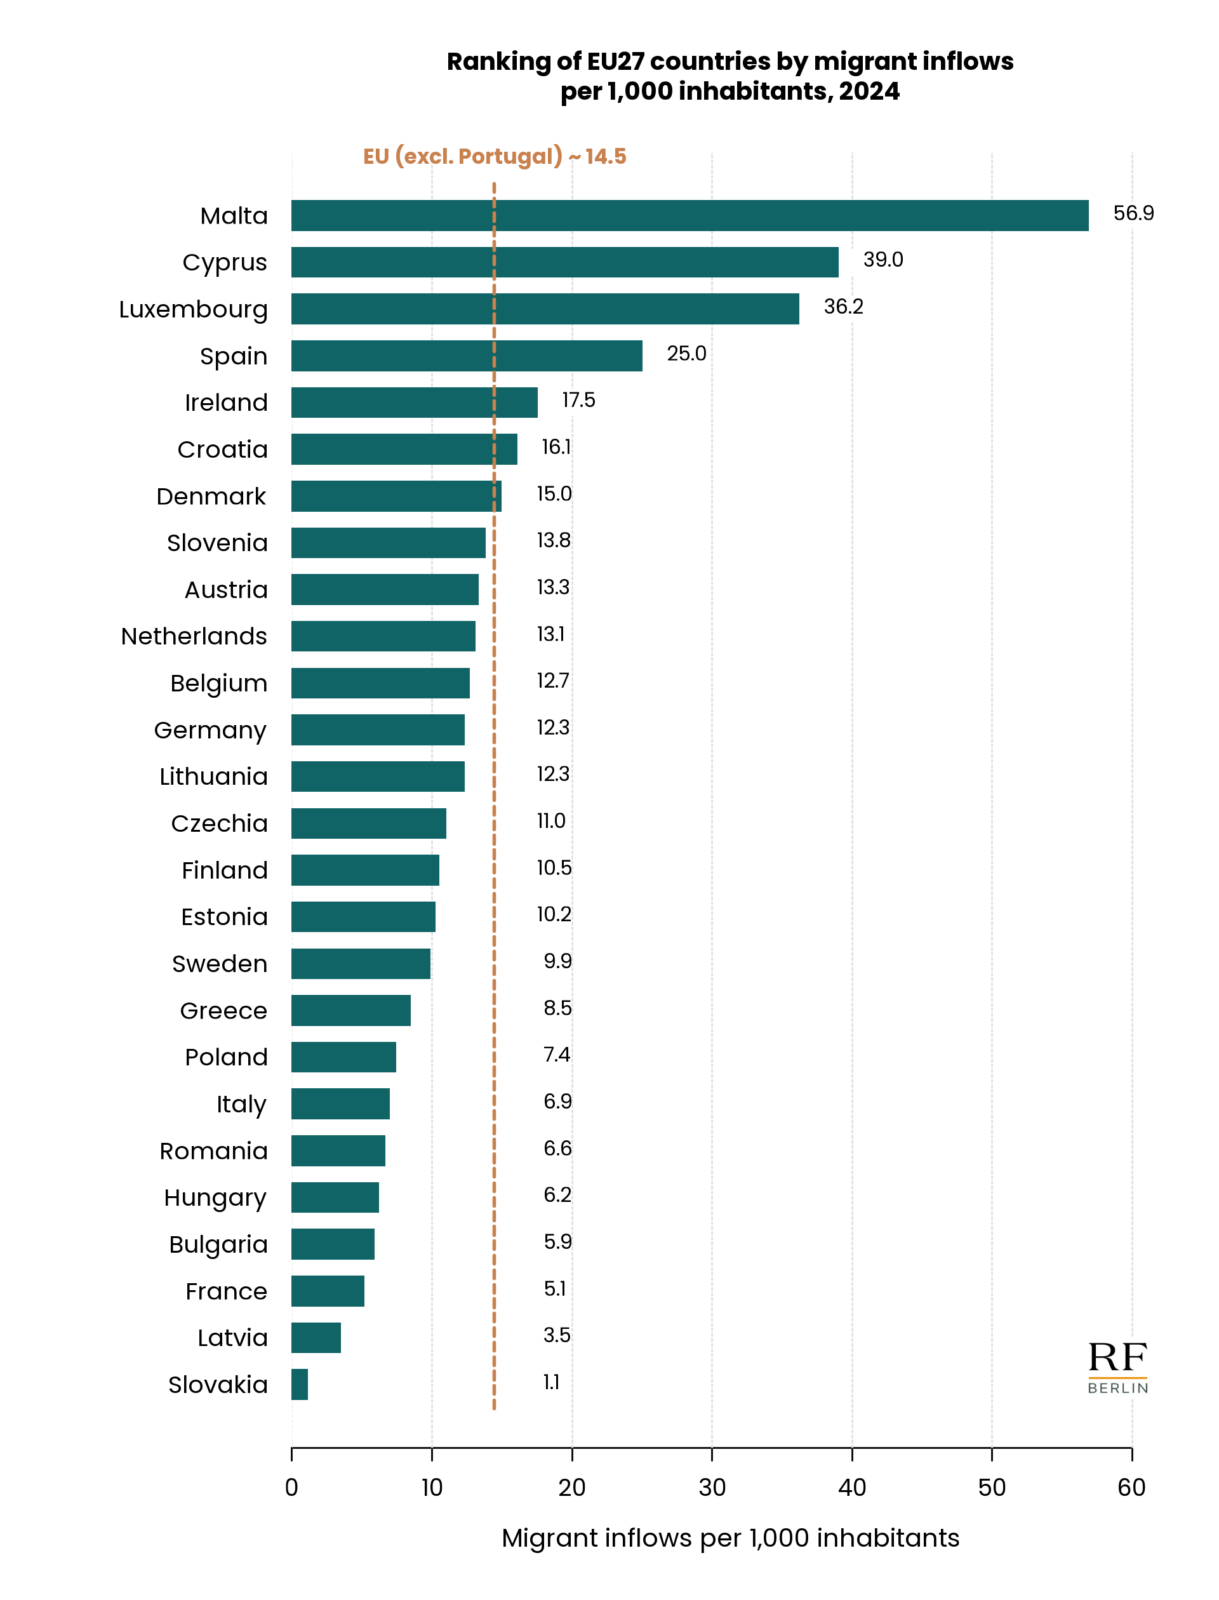
Source: Own calculation, based on data from Eurostat, MIGR_IMM3CTB (downloaded on 18 March 2026); MIGR_POP3CTB (downloaded on 18 March 2026). Notes: The figure reports the number of migrants per 1000 inhabitants who arrived in the named country during the year. Migrants are defined as individuals born in a country other than the one they are living in. The European Union includes all Member States as of 1 February 2020, except for Portugal, which is excluded due to missing data at the time of compiling this report.
A middle group, including Croatia, Denmark, Slovenia, Austria, the Netherlands, and Belgium, clusters between 13 and 16 arrivals per 1,000 inhabitants. By contrast, some large countries move down the ranking: Germany records around 12 per 1,000, and Italy about 7. At the lower end, France, Latvia, and Slovakia register fewer than 6 arrivals per 1,000 inhabitants.
Overall, the population-adjusted indicator highlights substantial cross-country variation in the relative scale of inflows, with smaller Member States often exhibiting higher per capita migration rates despite lower absolute numbers.
[1] Eurostat has not yet (as of April 16, 2026) released immigration data for Portugal in 2025. Thus, to ensure consistency, we have excluded Portugal from all aggregation in all years in this section. Whenever we refer to “EU”, we therefore refer to EU countries excluding Portugal.
[2] Eurostat has not yet (as of April 16, 2026) released migration inflows data for Portugal in 2024. Thus, whenever we refer to “EU”, we therefore refer to EU countries excluding Portugal.
Asylum in Europe: Concentration and Diversity
Asylum applications in the EU are highly concentrated in a small number of countries. Yet beneath this concentration lies a striking diversity in applicants’ origins, reflecting multiple migration routes into Europe.
In 2025, the total number of asylum applications in the EU amounted to 669,365, a decrease of 26.6% compared with 2024. Figure 6 ranks EU27 countries by the number of first-instance asylum applications in 2025, highlighting a strong concentration in a small number of destinations. Spain is by far the largest recipient, with around 141,000 applications, followed by Italy (127,000), France (116,000), and Germany (113,000). Together, these four countries account for roughly 74% of all asylum applications in the EU.
Figure 6
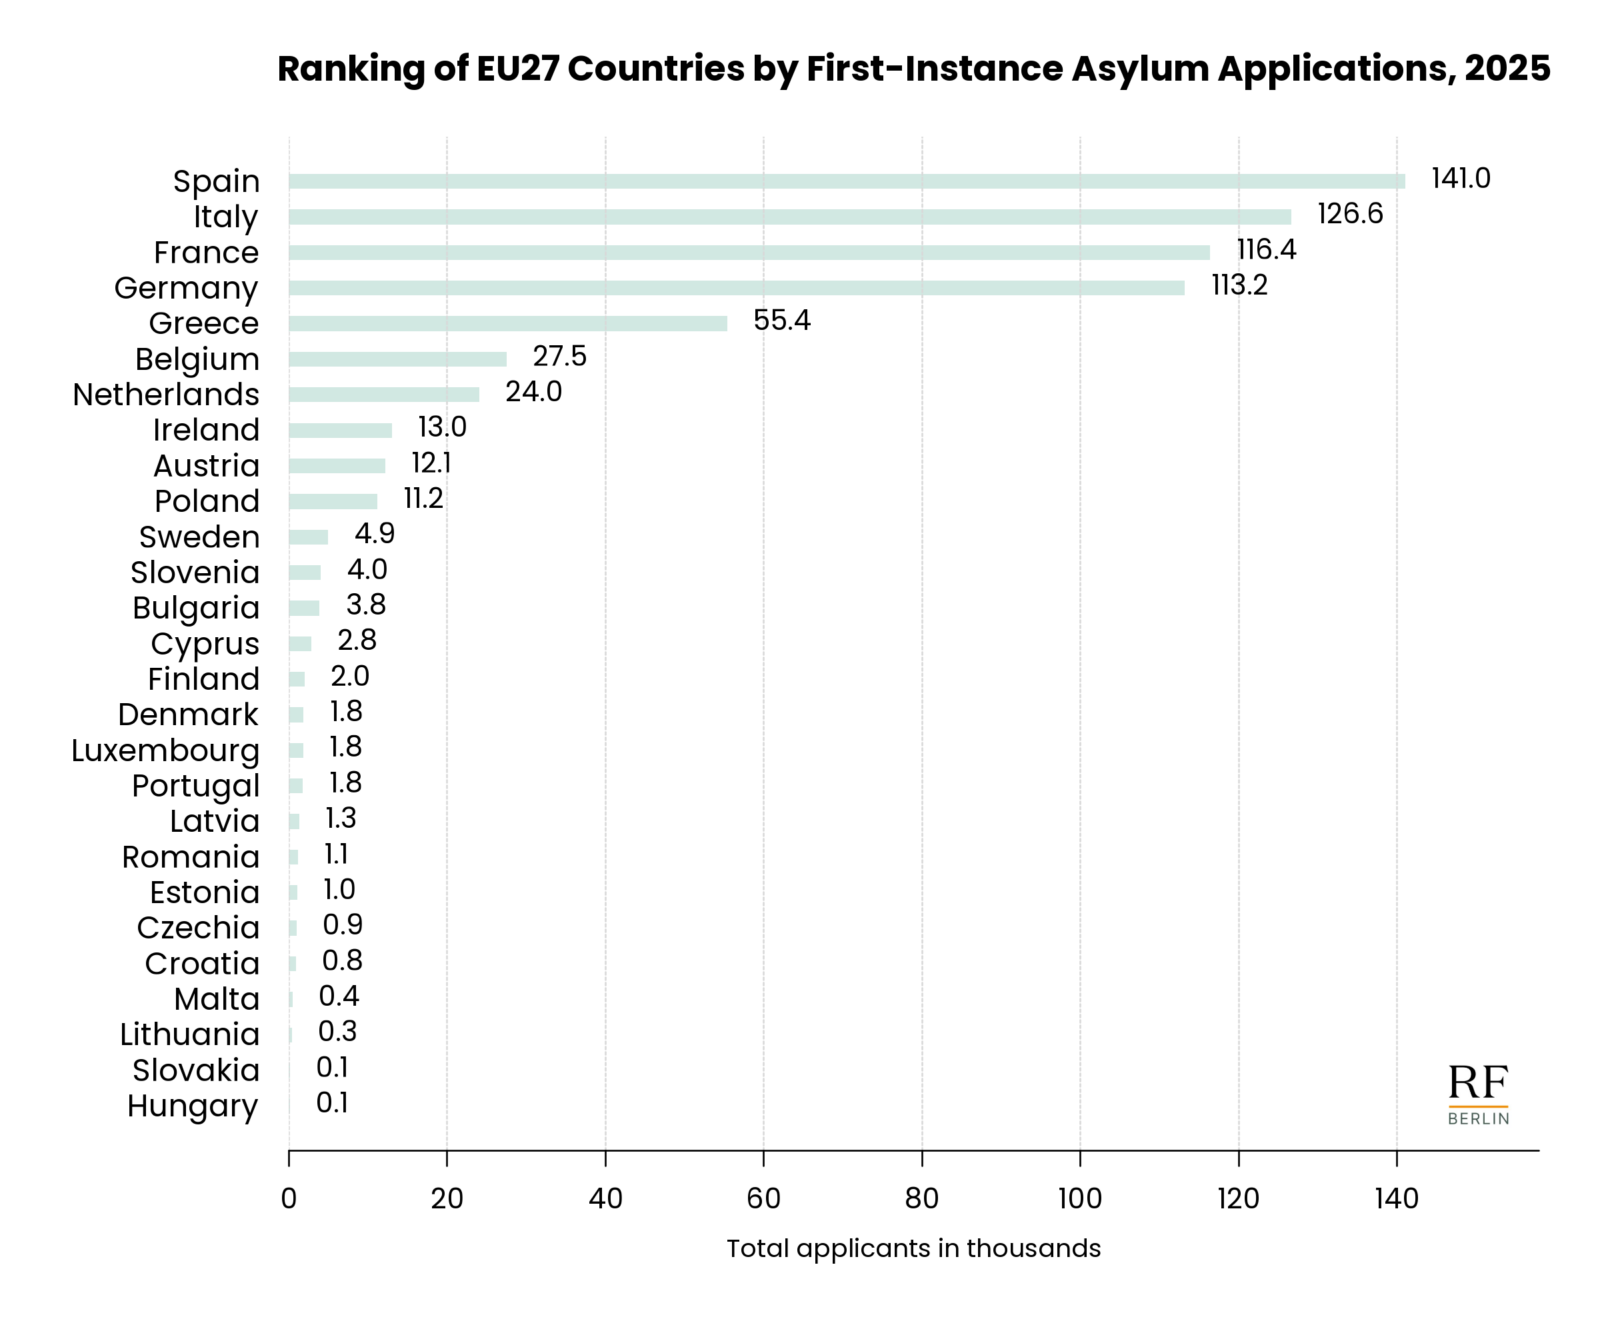
Source: Own calculation, based on data from Eurostat, MIGR_ASYAPPCTZA (downloaded on 30 March 2026). Notes: The figure reports the number of first-instance asylum applications in thousands submitted in EU countries during the year.
Beyond this core group, the distribution drops off sharply. Greece stands out as the only other country with a significant number of applications, at around 55,000, while all remaining Member States record fewer than 30,000 each.
Overall, asylum applications in the EU are highly concentrated, with a small set of countries handling the vast majority of cases.
Despite this strong concentration, the composition of asylum applications varies significantly across countries. While a small number of Member States receive the majority of applications, the origin of applicants differs markedly, pointing to distinct migration routes and underlying drivers. To illustrate this, Figure 7 examines Germany, Spain, Italy, and France, showing the main countries of origin that together account for approximately 65% of total first-instance asylum applications in each country in 2025. The resulting patterns differ markedly.
Figure 7
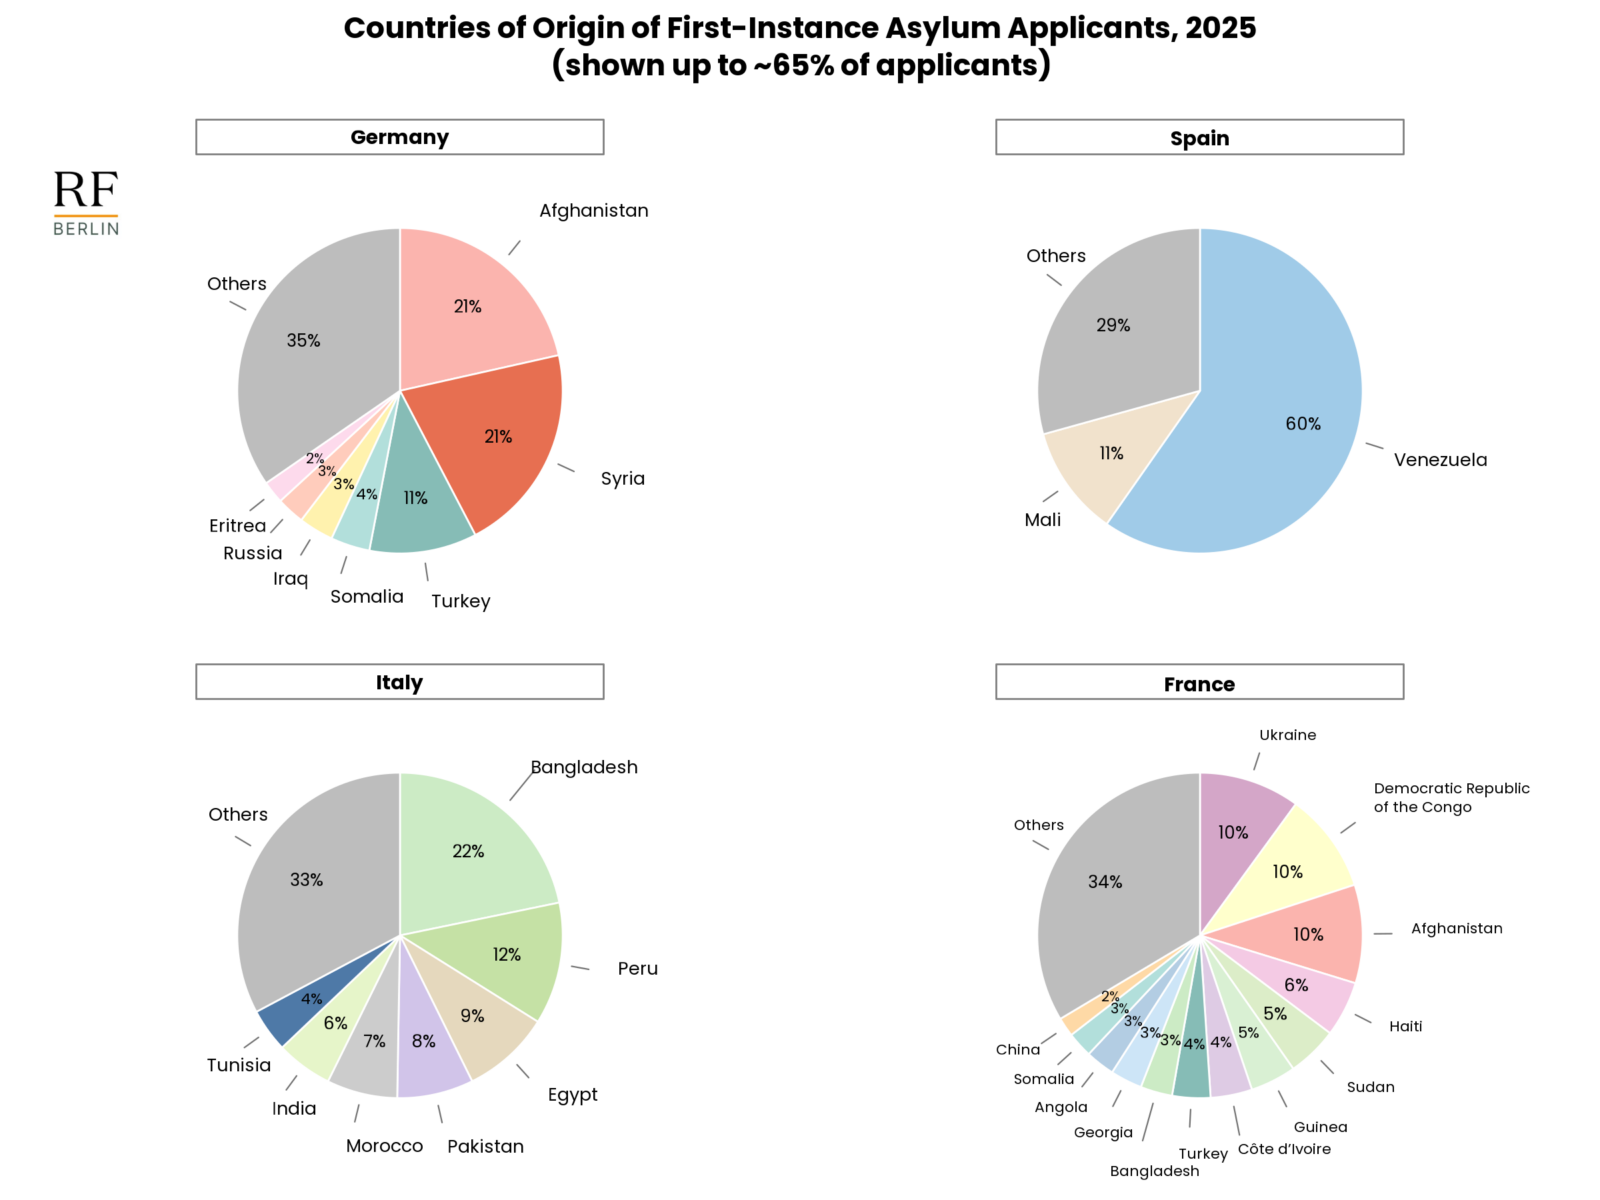
Source: Own calculation, based on data from Eurostat, MIGR_ASYAPPCTZA (downloaded on 30 March 2026). Notes: The figure reports the countries of origin of first-instance asylum applications submitted in Germany, Spain, Italy, and France during the year. For clarity, only countries of origin accounting cumulatively for up to 65% of applications are shown individually, while all remaining nationalities are grouped under “Others”.
Germany’s caseload is highly concentrated, with Afghanistan and Syria together accounting for about 42% of applications, followed by Turkey (11%). All other nationalities – including Somalia, Iraq, Russia, and Eritrea – represent relatively small shares (each accounts for around 4% or less). Spain shows an even stronger concentration: Venezuelans alone account for around 60% of applications, with Mali contributing a further 11%, bringing the combined share to more than two-thirds of the total.
Italy presents a more diversified profile than Germany and Spain, although one nationality still stands out. Bangladesh is the largest single country of origin, accounting for about 22% of total asylum applications, followed by Peru (12%). Applicants from Egypt and Pakistan represent each around 8-9% of the total, with smaller shares from Morocco (7%), India (6%), and Tunisia (4%). France, by contrast, displays the most fragmented composition. No single nationality dominates: Ukrainian, Congolese, and Afghan applicants each account for around 10%, followed by Haitian (6%), while all other groups remain below 5%.
These differences reflect distinct migration systems across Europe, shaped by geography, historical ties, and asylum recognition patterns. While Germany’s caseload is dominated by conflict-driven displacement, Spain’s reflects strong links with Latin America, and Italy and France receive more heterogeneous flows.
Refugees and Protection: Absolute vs. Relative Burden
The distribution of refugees across EU countries highlights a fundamental distinction between absolute numbers and relative burden. Countries that host the largest populations are not always those under the greatest proportional pressure.
Figure 8 ranks EU27 countries by the total number of refugees in 2025, again highlighting a strong concentration in a small number of Member States. Germany hosts by far the largest refugee population, with approximately 2.7 million refugees, more than double that of Poland, the second-ranked country (around 1 million). France follows with around 751,000 refugees, while Spain and Czechia host 471,000 and 381,000, respectively.
Italy (around 314,000), Austria (281,000), and the Netherlands (263,000) also record substantial numbers, while most other EU countries host fewer than 200,000 refugees.
Figure 8
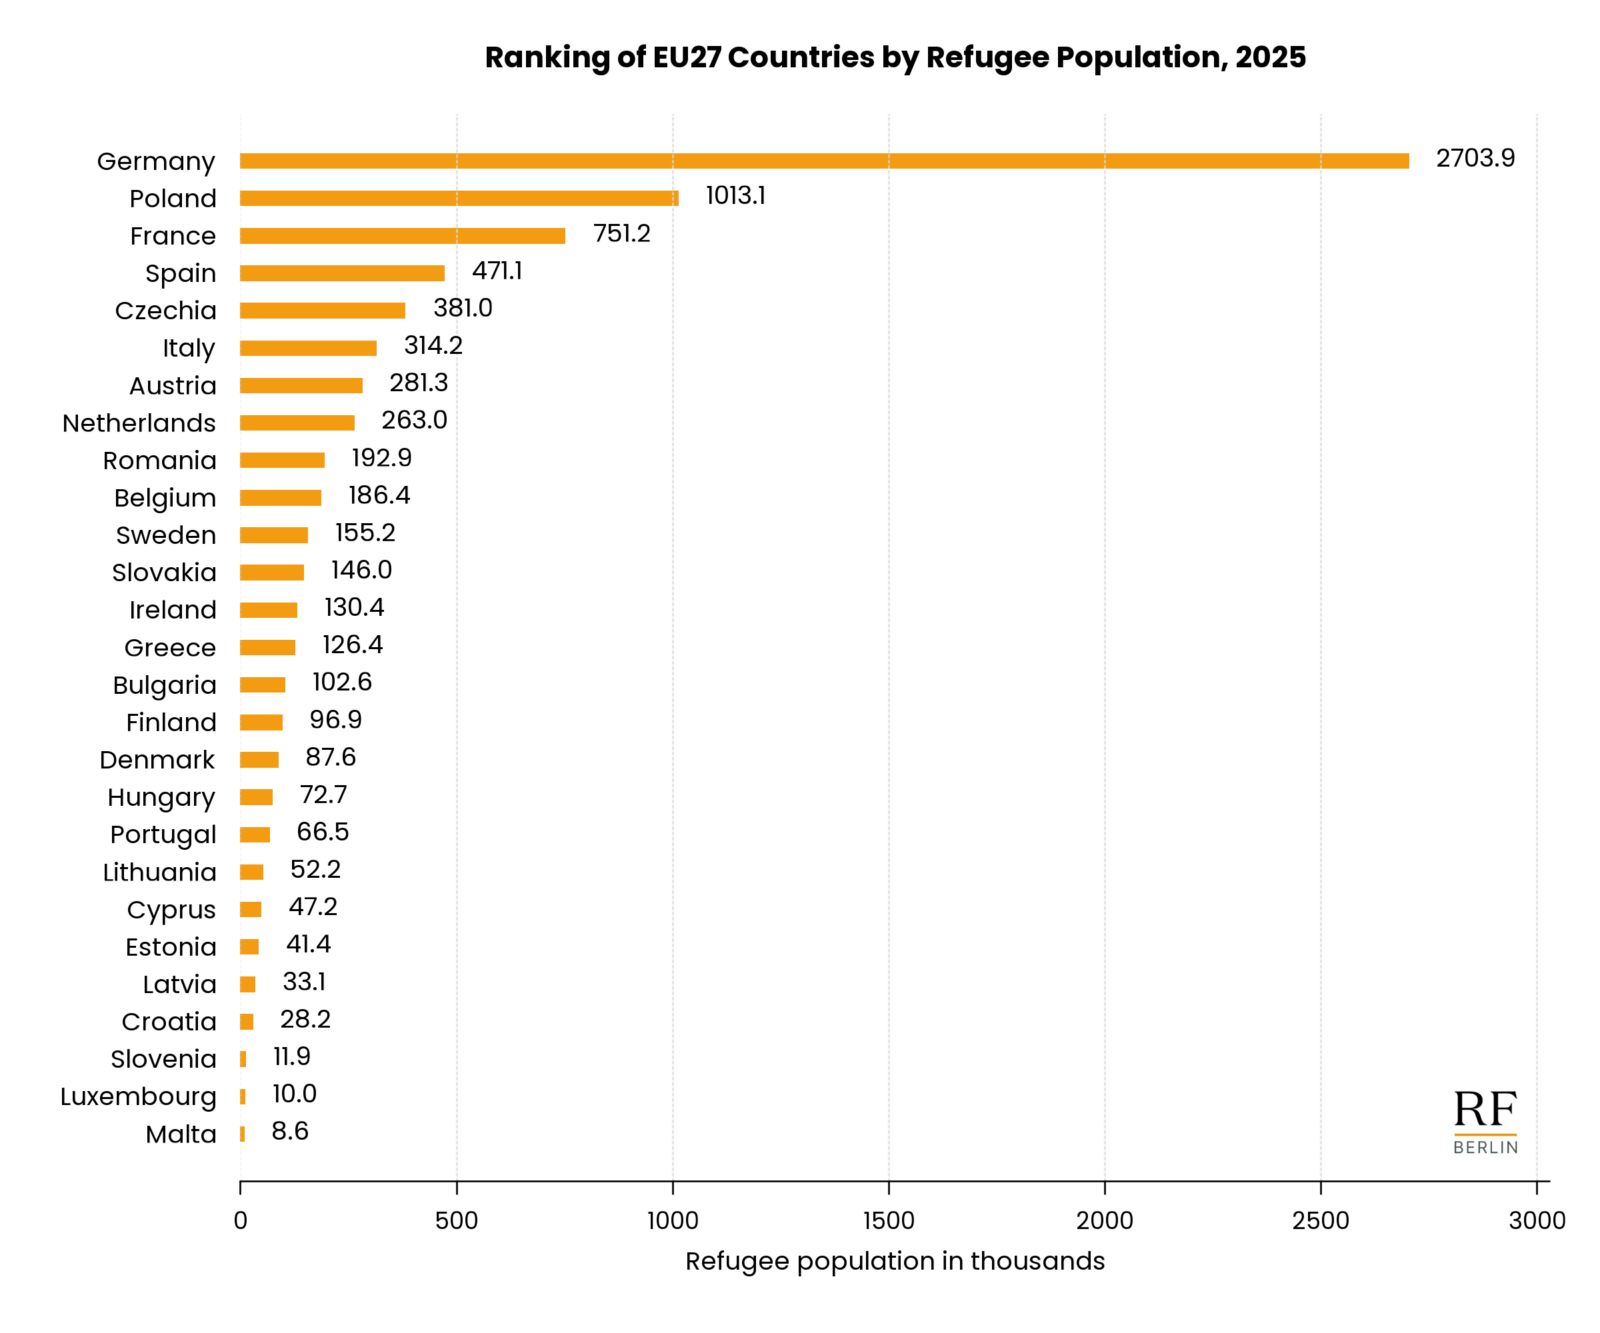
Source: Own calculation, based on data from UNHCR (downloaded on 23 March 2026). Notes: Refugees include individuals recognized under the 1951 Convention relating to the Status of Refugees, its 1967 Protocol, the 1969 Organization of African Unity (OAU) Convention Governing the Specific Aspects of Refugee Problems in Africa, the refugee definition contained in the 1984 Cartagena Declaration on Refugees as incorporated into national laws, those recognized in accordance with the UNHCR Statute, individuals granted complementary forms of protection, and those enjoying temporary protection. The refugee population also includes people in refugee-like situations. This includes displaced persons from Ukraine benefiting from temporary protection in EU member states. The figure reports data for the 27 member states in the European Union, including all 27 member states as of February 1, 2020.
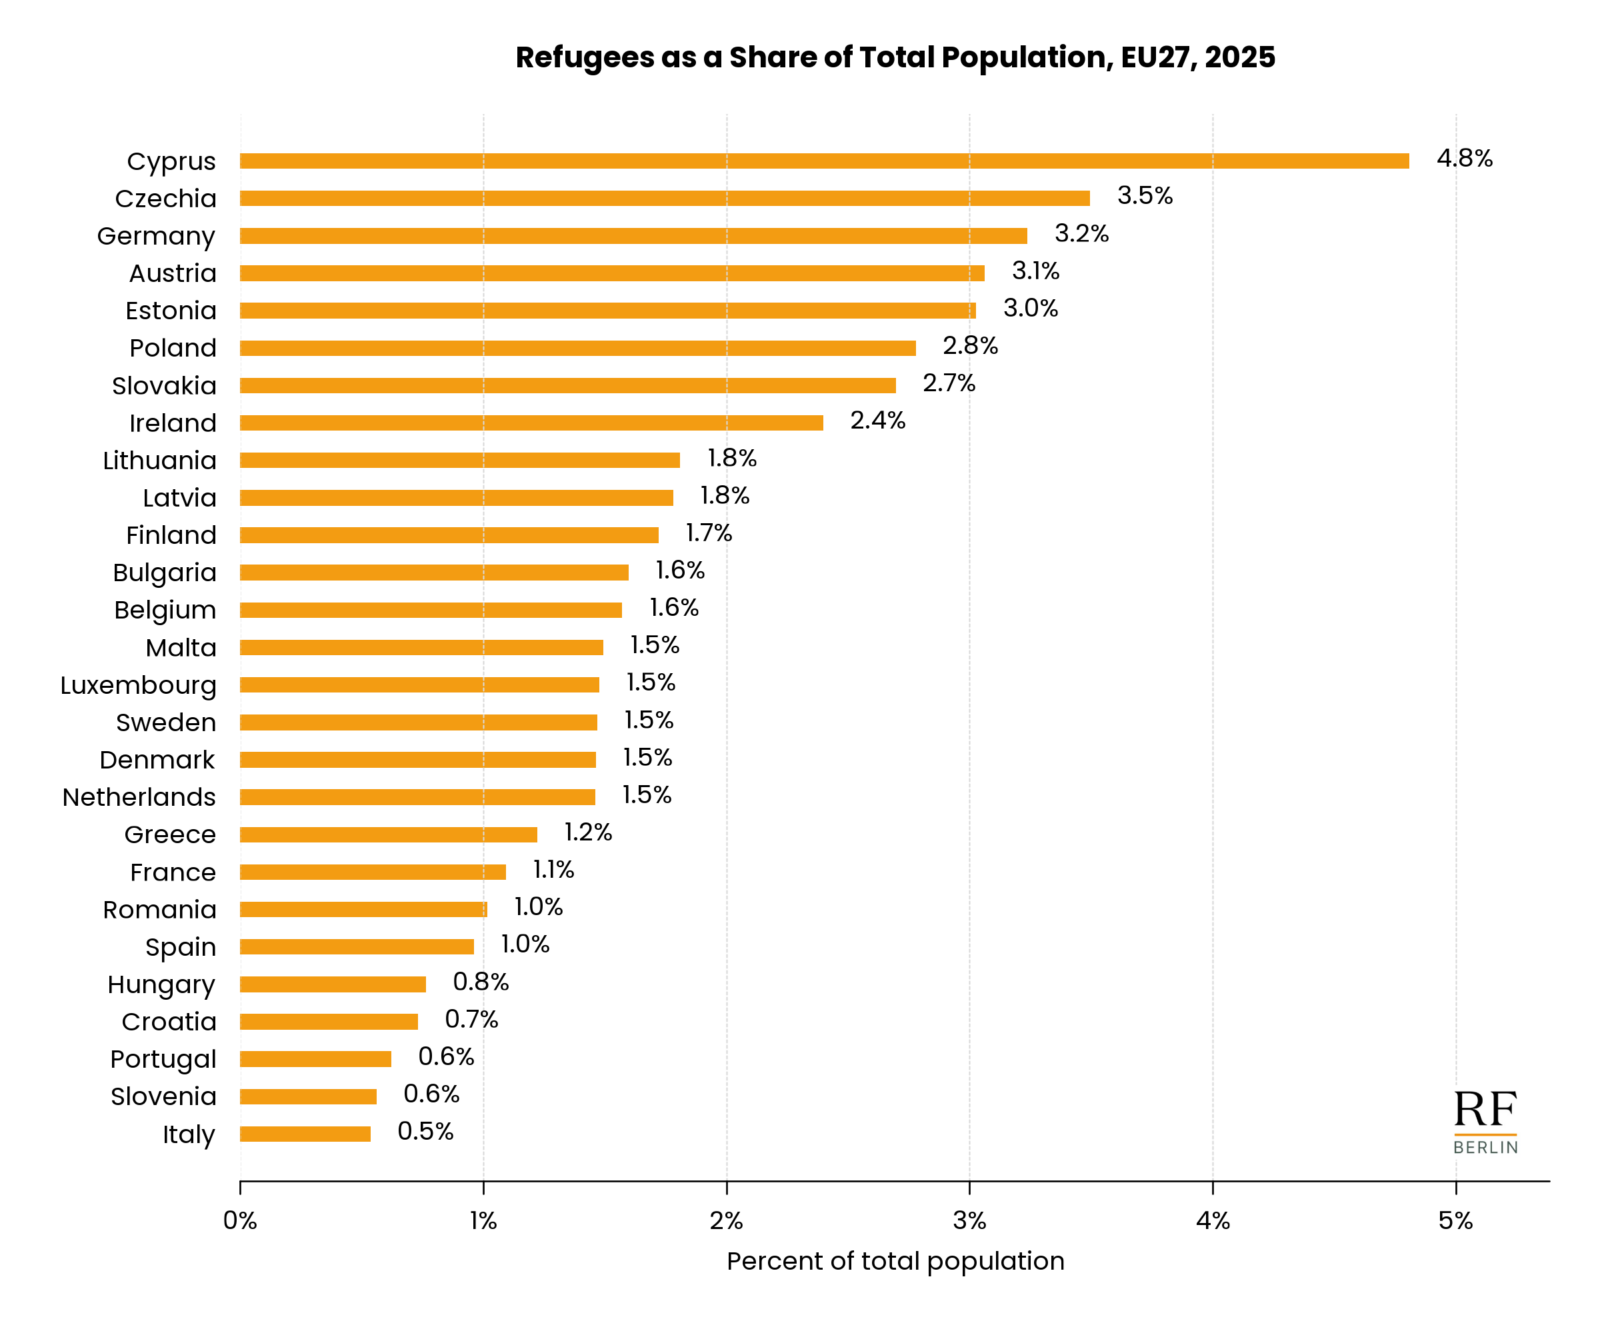
Figure 9 presents the same distribution adjusted for population size, revealing a markedly different ranking.
Figure 9
Source: Own calculation, based on data from UNHCR (downloaded on 23 March 2026); MIGR_POP3CTB (downloaded on 18 March 2026). Notes: Refugees include individuals recognized under the 1951 Convention relating to the Status of Refugees, its 1967 Protocol, the 1969 Organization of African Unity (OAU) Convention Governing the Specific Aspects of Refugee Problems in Africa, the refugee definition contained in the 1984 Cartagena Declaration on Refugees as incorporated into national laws, those recognized in accordance with the UNHCR Statute, individuals granted complementary forms of protection, and those enjoying temporary protection. The refugee population also includes people in refugee-like situations. This includes displaced persons from Ukraine benefiting from temporary protection in EU member states. The figure reports data for the 27 member states in the European Union, including all 27 member states as of February 1, 2020.
Cyprus stands out, with refugees accounting for 4.8% of its population, followed by Czechia (3.5%) and Germany (3.2%). Notably, Germany remains among the countries with the highest shares even after adjusting for population size.
Austria (3.1%) and Estonia (3.0%) also report high shares, followed by Poland (2.8%), Slovakia (2.7%) and Ireland (2.4%). A broader middle group of countries – such as Lithuania, Latvia, Finland, Bulgaria, Belgium, Malta, Luxembourg, Sweden, Denmark and the Netherlands – registers shares between 1.5 and 1.8%.
By contrast, several large countries rank much lower in relative terms. Spain and Romania are around 1.0%, while France (1.1%) and Italy (0.5%) remain comparatively low despite their sizeable populations. At the lower end, Portugal and Slovenia (around 0.6%) and Croatia (0.7%) record relatively small refugee shares.
Overall, the comparison between absolute and relative measures highlights a familiar pattern: countries hosting the largest numbers are not necessarily those facing the greatest proportional exposure.
Key Findings and Implications
Europe’s migration landscape is shaped by demographic pressures, geopolitical shocks, and persistent imbalances across countries. Recent years have seen exceptionally strong increases, particularly following the displacement triggered by the war in Ukraine. Growth remained robust in 2025, with the foreign-born population increasing by around 2.1 million. Spain stands out for a particularly pronounced surge, accounting for roughly one-third of the overall increase. These dynamics highlight how quickly migration responds to changes in economic conditions, policy frameworks, and international crises. The recent international developments are likely to continue shaping this picture in the next year.
A key takeaway is the extent of cross-country asymmetry. Germany and Spain dominate in absolute terms, but smaller countries such as Luxembourg, Malta, and Cyprus face the highest impact relative to their population. These gaps are not just statistical: they translate into very different administrative burdens, political dynamics, and policy constraints.
Asylum patterns sharpen this divide. Germany, Spain, Italy, and France receive nearly three-quarters of all EU applications, yet the composition of flows differs markedly. Germany’s caseload is driven by Afghans, Syrians, and Turks; Spain’s by Venezuelan applicants; Italy’s and especially France’s by a more mixed set of origins. Migration to Europe is not a single phenomenon, but a set of distinct and overlapping systems.
Refugee distribution reinforces these asymmetries. Germany remains the largest host in absolute terms, while countries such as Cyprus, Czechia, and Austria carry a much heavier burden relative to their population. This imbalance lies at the core of ongoing debates over responsibility-sharing within the EU.
Overall, Europe’s migration system combines long-term growth with short-term volatility and deep structural differences across countries. Any effective policy response will need to account for all three – moving beyond aggregate numbers and toward a more differentiated and coordinated approach.
Technical Appendix
Data
The analysis relies on the following datasets:
1. Migrant stocks: Eurostat dataset MIGR_POP3CTB (Population on 1 January by country of birth), downloaded on 31 March 2026. This dataset is used to construct all figures and statistics related to the foreign-born population (stocks) in the EU and individual Member States (Figures 1, 2 and 3).
2. Migration flows: Eurostat dataset MIGR_IMM3CTB (Immigration by country of birth), downloaded on 18 March 2026. This dataset is used to analyse annual inflows of migrants (Figures 4 and 5).
3. Asylum applications: Eurostat dataset MIGR_ASYAPPCTZA, downloaded on 30 March 2026. This dataset provides information on first-instance asylum applications and their country of origin (Figures 6 and 7).
4. Refugee populations: Data from UNHCR, downloaded on 23 March 2026. These data are used to analyse the stock of refugees and beneficiaries of protection (Figures 8 and 9).
Definition of Foreign-Born Population
We define as “immigrants” or “foreign-born individuals” persons residing in a country other than their country of birth, or individuals with unknown country of birth. The inclusion of individuals with unknown country of birth among immigrants has practical implications for Slovakia (5.8% of the immigrant population in 2025), Germany (3.22%), Finland (2.93%), Czechia (2.35%), and Poland (2.11%). In most other EU Member States, this share remains below 1%.
Treatment of Portugal
Data for Portugal are missing for the most recent years in both the Eurostat flow dataset (MIGR_IMM3CTB) and the Eurostat stock dataset (MIGR_POP3CTB). Portugal is therefore excluded from the migration flow and stock analysis from Figures 1 to 5 and the related discussion.