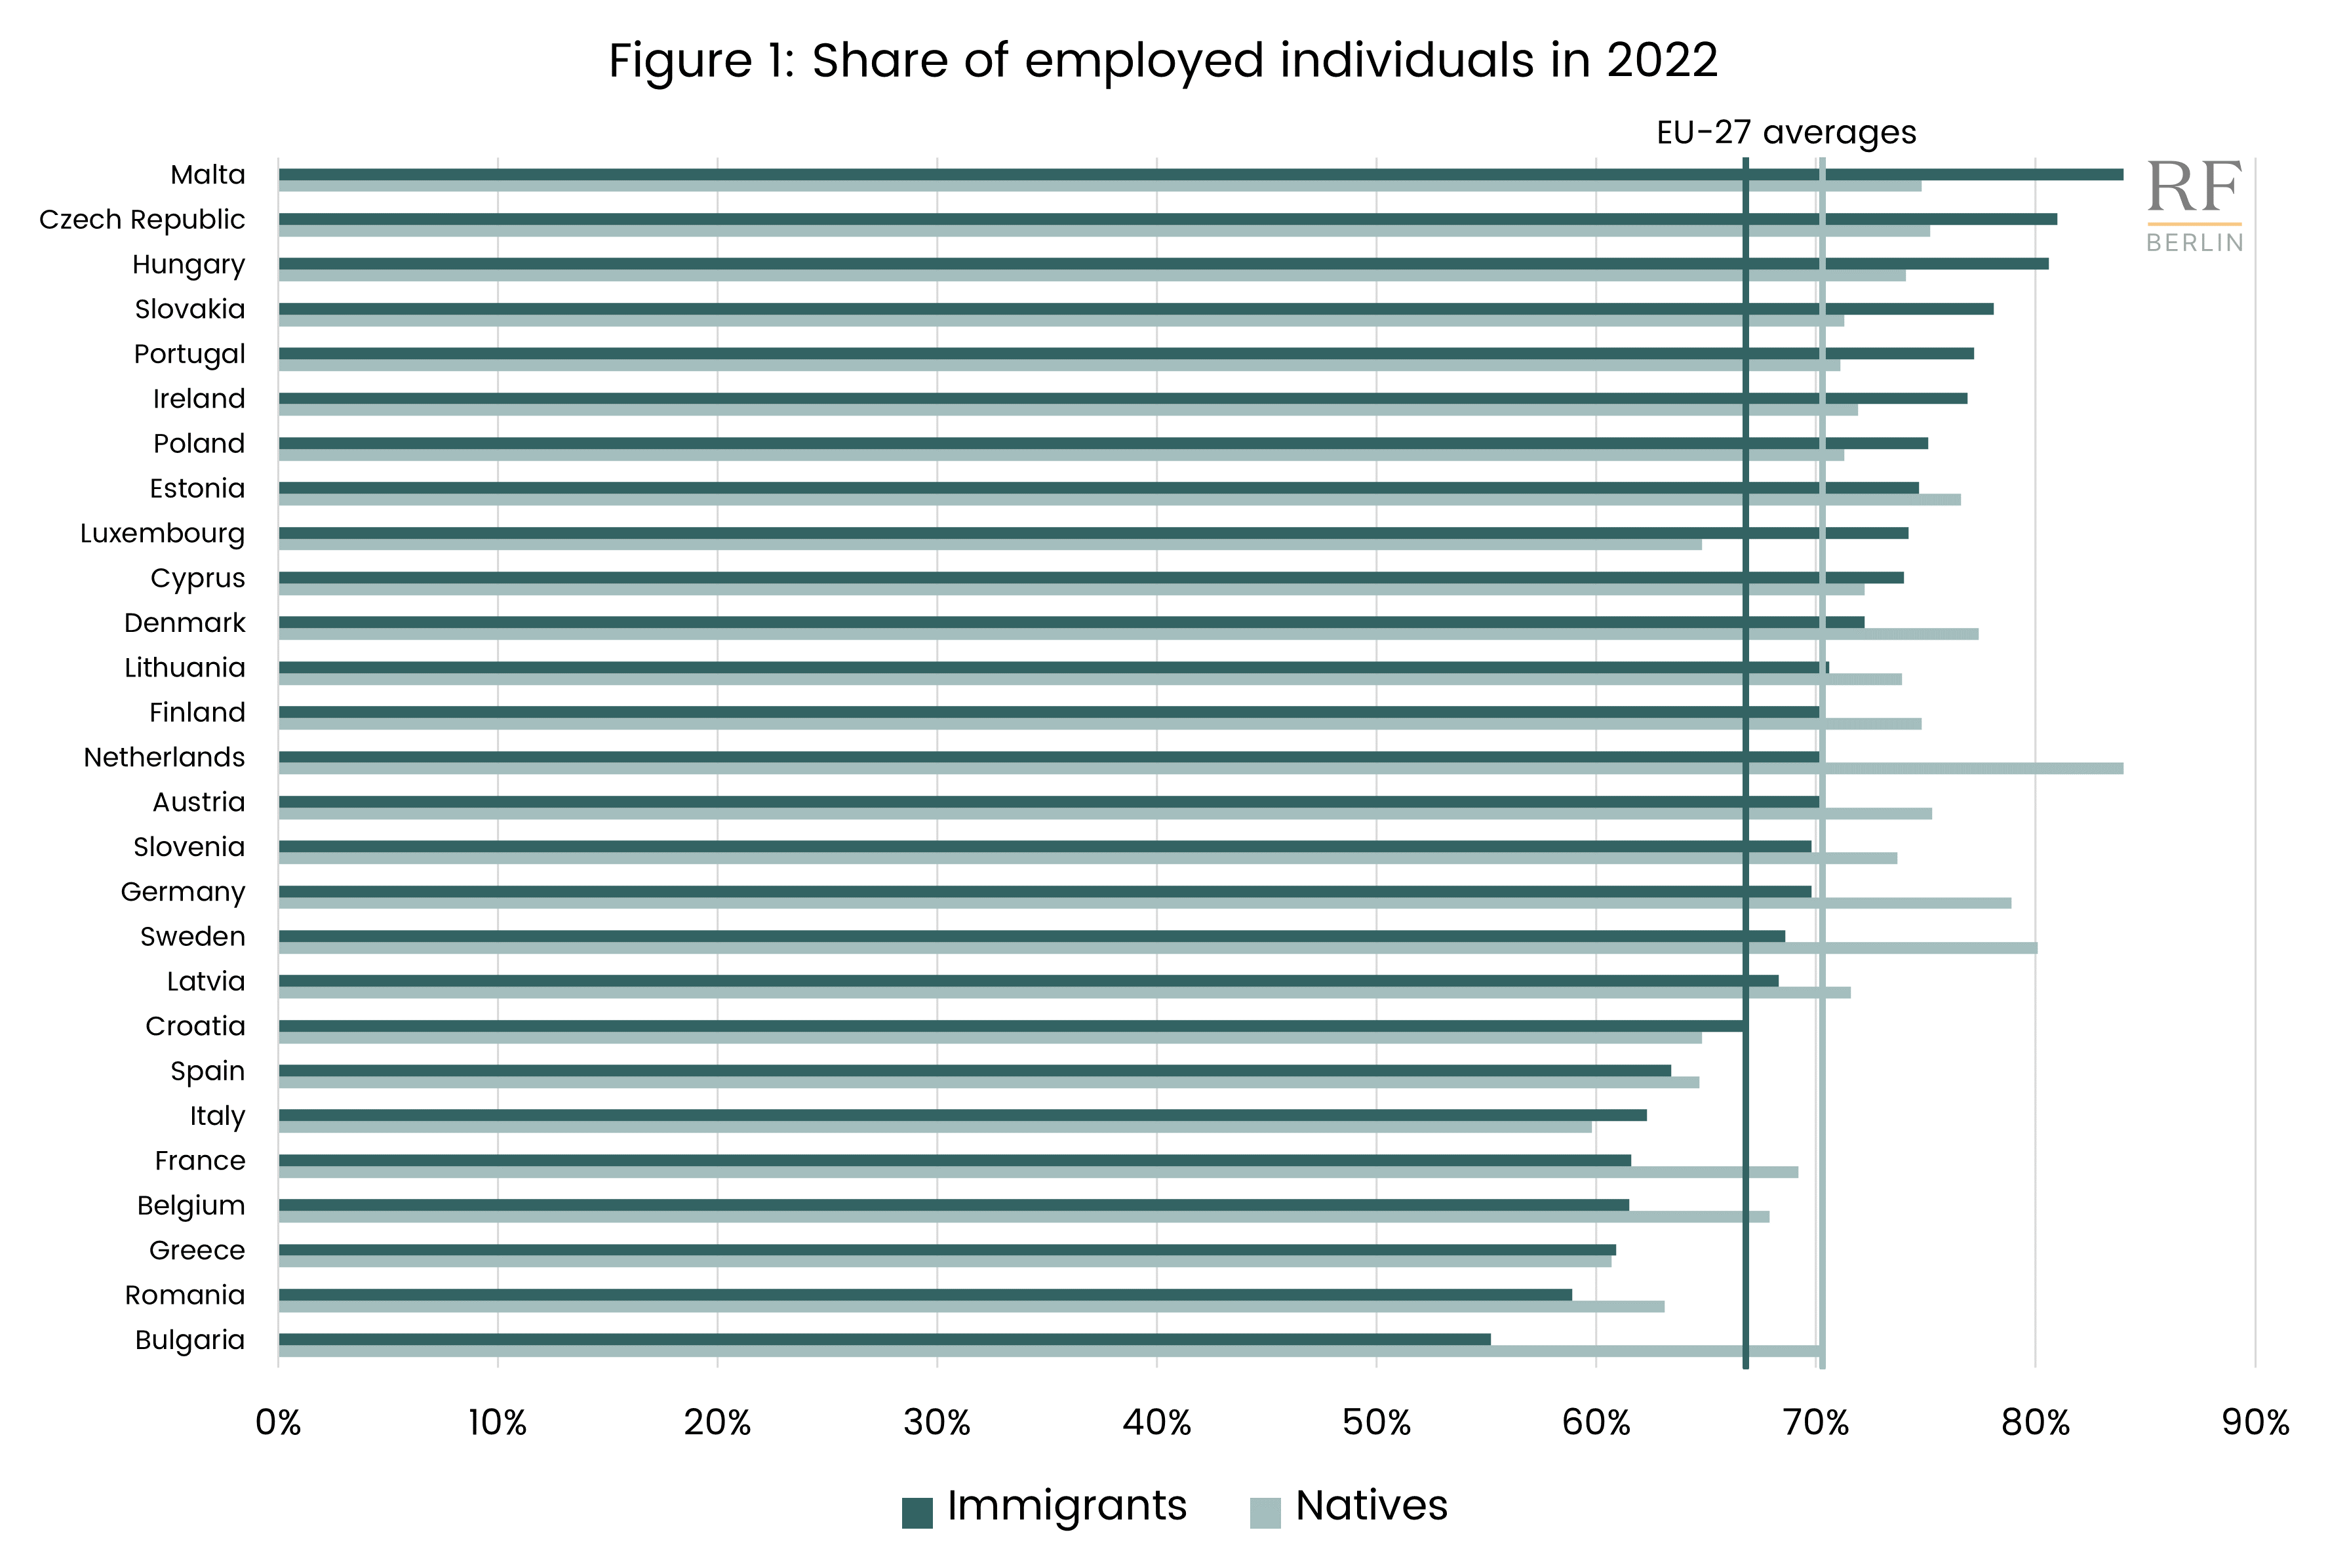
Natives in the European Union are more likely to be employed compared to foreign-born individuals, with employment rates of 70% and 67% respectively. Figure 1 illustrates the employment rates of native and immigrant populations in the European Union for the year 2022. The countries where immigrants have the largest gaps in employment probability relative to natives are Bulgaria (15 percentage points) and the Netherlands (14 percentage points). On the other hand, there are some countries where immigrants have a higher employment rate than natives: the countries where such positive differential is highest are Luxembourg and Malta (around 9 percentage points in both).

Figure 2 illustrates how the employment rates of immigrants have evolved between 2012 and 2022. In most EU countries (excluding Bulgaria and Romania), there was an overall increase in employment among foreign-born individuals during this time. On average, immigrants’ employment rate rose from 61% to 67% across all EU countries, an increase that mirrors the corresponding growth for native-born individuals from 64% to 70%. The highest increases in immigrant employment rates were observed in Croatia (+18 percentage points) and Ireland (+17 percentage points). Conversely, only in Romania did the employment rate for immigrants decrease between 2012 and 2022, which corresponds to the fact that Romania experienced the biggest decline in the proportion of immigrants with tertiary education between 2012 and 2022 (see our article on Immigration and education).

The gender gap in employment probability is substantially higher among immigrants than among natives. While in 2022 native women were 9 percentage points less likely to be employed than their male counterparts, immigrant women were 17 percentage points less likely to be employed than immigrant men in the European Union. We show this in Figure 3, which displays the gender gaps in employment probability, i.e., the share of employed men minus the share of employed women, for natives and immigrants. Greece has the largest employment gap between immigrant men and women, followed by Italy (34 percentage points and 28 percentage points, respectively). These are also the two countries where the native gender gap in employment is highest.

Figure 4 presents the evolution of employment share for immigrants and natives by gender in the EU between 2012 and 2022. Native and immigrant men have similar levels of employment, with immigrants’ employment probability even slightly higher than natives’ in 2022. However, the employment probability of native women is consistently higher than for immigrants. Over time, the gap between native and immigrant women’s employment rates increased, from 5 percentage points in 2012 to 8 percentage points in 2022.
The graph also shows clearly how the COVID-induced recession of 2020 affected disproportionately the employment of immigrants: their employment probability fell more sharply than for natives in 2020. Moreover, while the employment of natives was back to pre-pandemic level by 2021, it was not until 2022 that immigrants’ employment rate surpassed the 2019 level.

Found this interesting? You can find more data and additional visualization tools in our dashboard here.
Technical notes
- Data source: Eurostat (LFSA_ERGAEDCOB).
- Immigrants are defined as individuals born in another country than the one they are living in. Our sample consists of working-age (15 and 64) individuals in the EU-27 countries. Note that Romania is not included in Figure 3 due to missing data.
- The gender gap in employment in country c at time t presented in Figure 3 is calculated as follows: male employment sharect – female employment sharect.
Copyright: All content presented in this article can be reproduced, modified, distributed, or republished, in whole or in part, provided that such uses are for personal, educational, scientific, or non-commercial purposes, so long as attribution is given to the ROCKWOOL Foundation Berlin. The content must not be manipulated, edited, or altered in a way that may misrepresent its initial intent or significance. Any excerpt, quote, or reproduction of the content should be presented accurately and in context.


